Objective of epidemiologic research
“To obtain a valid, precise, and generalizable estimate of the effect of an exposure on the occurrence of an outcome (e.g., disease)”
- Design → enhance the precision and validity of the effect estimate
- No study is perfect
- Interpret the precision and validity of the effect estimate

T. Lash, M. Fox. Applying Quantitative Bias Analysis to Epidemiologic Data
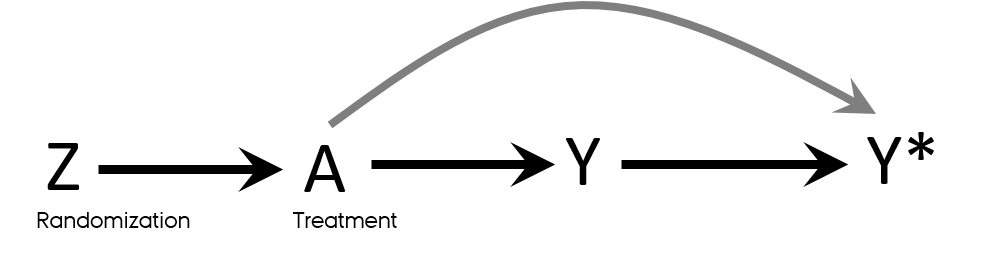
Counterfactual vs factual worlds
- Counterfactual comparisons of exposed and unexposed → perfect and impossible
- RCTs → closest we can get to the counterfactual comparison of exposed and unexposed
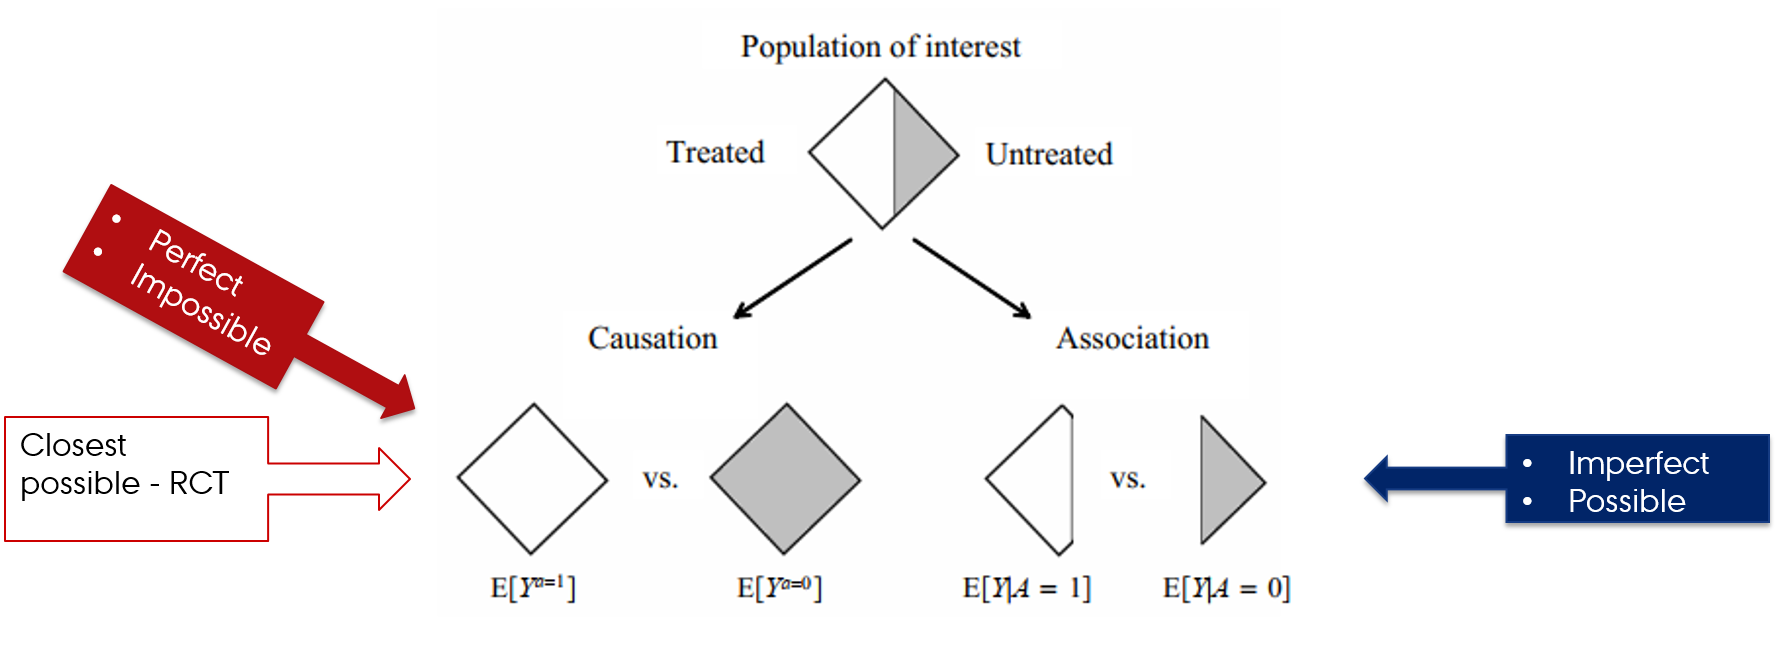
Hernán MA, Robins JM (2020). Causal Inference: What If. Boca Raton: Chapman & Hall/CRC.
Estimating magnitude of effect in epidemiologic studies
- Design
- Data
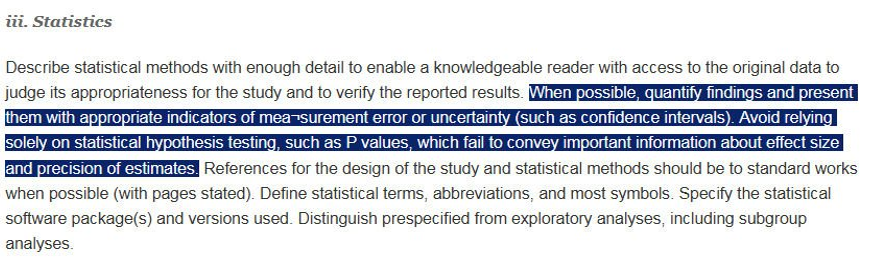
- Statistical analyses

![]()

![]()

Error in epidemiologic research
- Random error
- Sampling (random) variability
- Chance
- Systematic error (bias)
- Selection bias
- Confounding
- Measurement (information) bias

Validity
- No bias
- Valid study = Study with minimal bias (systematic error)
- Internal validity
- The validity of the inferences about the source population
- External validity
- Generalizability
- Validity of the inferences about people outside source population
- Internal validity → external validity

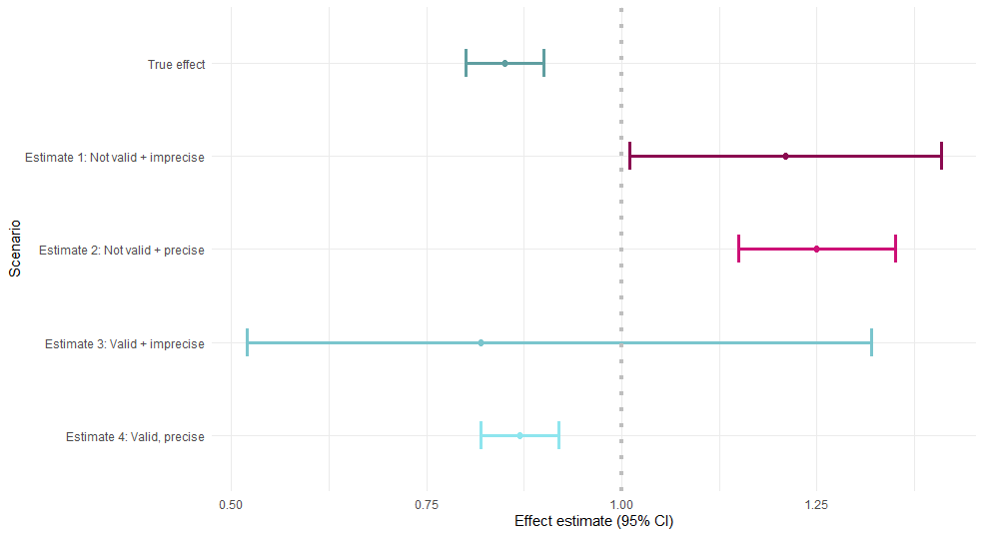
Accuracy
- Value of the parameter is estimated with little error
- Errors in estimation: random or systematic
Had we known the true effect of the exposure on the outcome (simulation):
Precision
- No random error
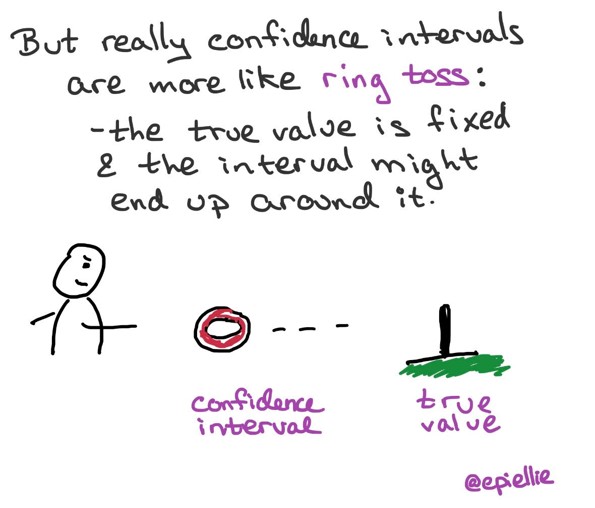
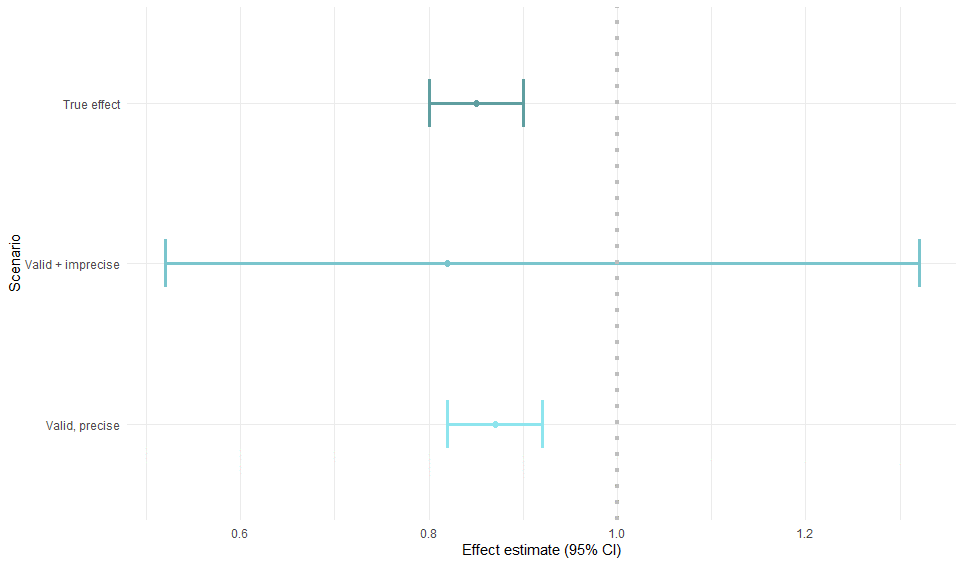
Confidence intervals
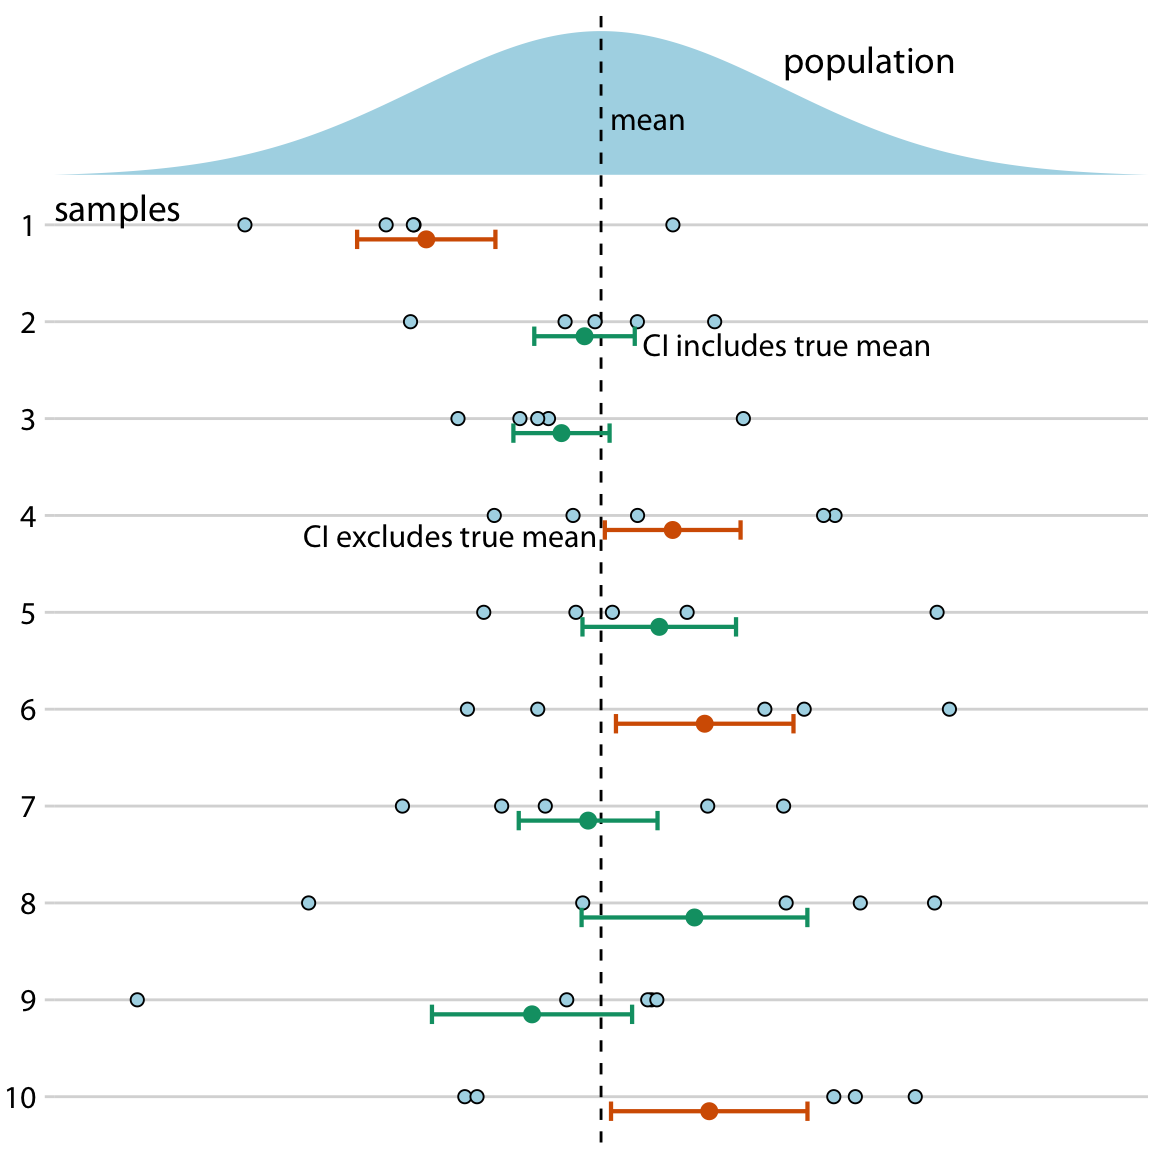
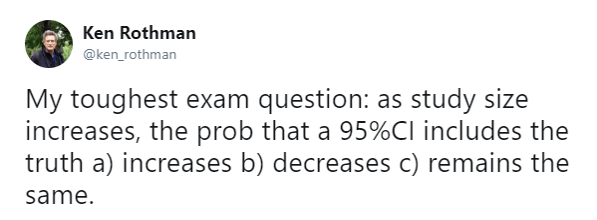
- 95% of the time 95% CI contains the true parameter
95 % refers only to how often 95 % confidence intervals computed from very many studies would contain the true size if all the assumptions used to compute the intervals were correct
- Claus Wilke, Data visualization
- Greenland S, Senn SJ, Rothman KJ, et al. Statistical tests, P values, confidence intervals, and power: a guide to misinterpretations. Eur J Epidemiol. 2016;31(4):337-350. link
Study size and precision
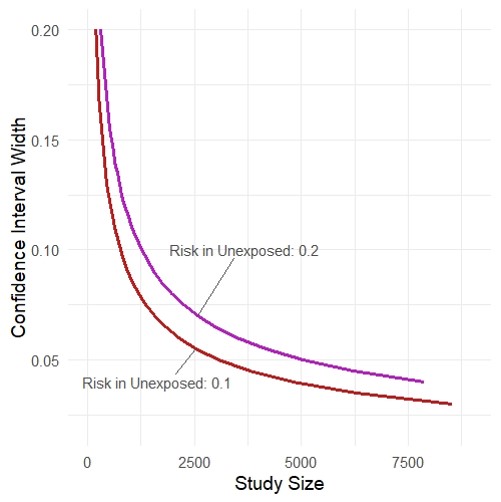
- Rothman KJ, Greenland S. Planning Study Size Based on Precision Rather than Power. Epidemiology. Published online June 14, 2018. link
- https://github.com/malcolmbarrett/precisely
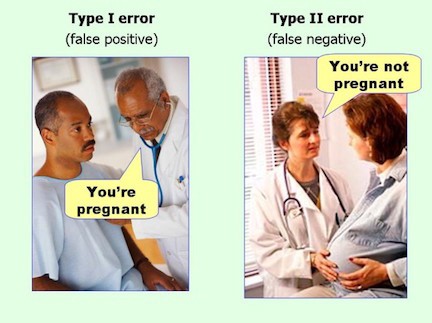
Type I and II errors
What p-value is not
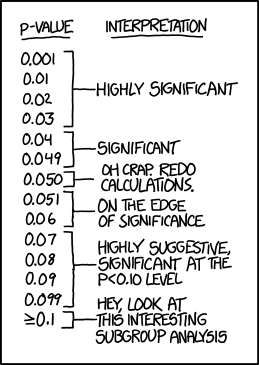
- Is not the probability that the test hypothesis is true
- P value is computed assuming the test hypothesis is true
- Is not the probability that chance alone produced the observed association
- Does not say that the test hypothesis is false or should be rejected or the test hypothesis is true or should be accepted
- P>0.05 does not say that no effect was observed/absence of an effect was observed
- Null is one among the many hypotheses with P>0.05
- Does not say anything about the effect
- Very small effects or assumption violations can show statistically significant tests of the null hypothesis when the study is large
- Is not the chance of the data occurring if the test hypothesis is true
Greenland S, Senn SJ, Rothman KJ, Carlin JB, Poole C, Goodman SN, et al. Statistical tests, P values, confidence intervals, and power: a guide to misinterpretations. Eur J Epidemiol. 2016;31(4):337-50.
95% Confidence Interval misinterpretation and p-value function
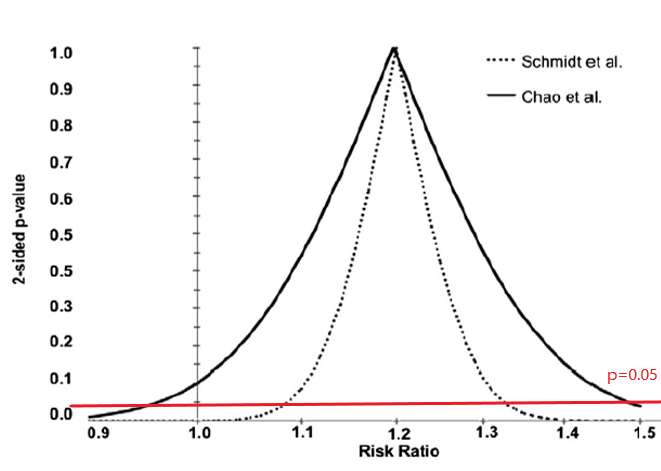
Schmidt M, Rothman KJ. Mistaken inference caused by reliance on and misinterpretation of a significance test. Int J Cardiol. 2014;177(3):1089-90.
15 min break

Threat to validity: Bias
- Can not be remedied by large (infinite) sample size
- Can not be remedied by pooling studies
- Often is larger than random error
Threat to validity: Bias
- Can not be remedied by large (infinite) sample size
- Can not be remedied by pooling studies
- Often is larger than random error

Selection
- Selection ≠ selection bias
- Strict inclusion/exclusion criteria or sampling from a subset of a population
- Not representative of population as a whole
- May not be a problem
- Depends on how much is known about the mechanism of effect
- “Representativeness does not, in itself, deliver valid scientific inference”
- May enhance internal validity
- Potential threat to external validity
Rothman KJ, Gallacher JE, Hatch EE. Why representativeness should be avoided. Int J Epidemiol. 2013;42(4):1012-4
Selection bias
Errors due to systematic differences in characteristics between those who are selected for study and those who are not
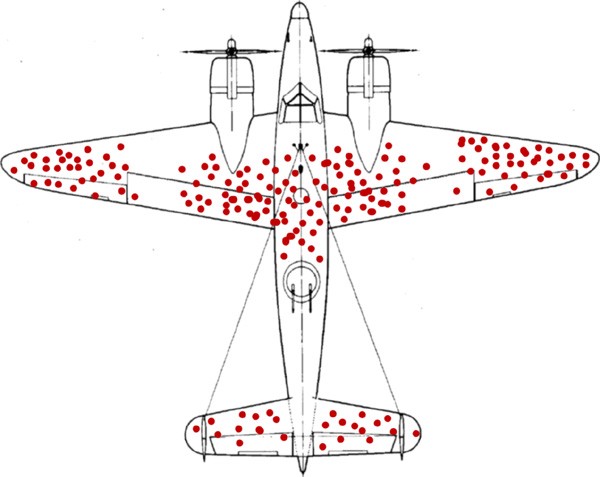
survivorship bias
Selection bias

- Risk of the outcome in exposed and unexposed in all eligible?
Selection bias
- Risk of the outcome in exposed and unexposed in all eligible?
- 100/1000 = 10% (same outcome risk in exposed and unexposed in all eligible)
Selection bias
- Risk of the outcome in exposed and unexposed in all eligible?
- 100/1000 = 10% (same outcome risk in exposed and unexposed in all eligible)
- Exposure-Outcome association in all eligible: RR = ?
Selection bias
- Risk of the outcome in exposed and unexposed in all eligible?
- 100/1000 = 10% (same outcome risk in exposed and unexposed in all eligible)
- Exposure-Outcome association in all eligible: RR = ?
- (100/1000) / (100/1000) = 1.0
Selection bias
- Risk of the outcome in exposed and unexposed in all eligible?
- 100/1000 = 10% (same outcome risk in exposed and unexposed in all eligible)
- Exposure-Outcome association in all eligible: RR = ?
- (100/1000) / (100/1000) = 1.0
- Exposure-Outcome association in participants: RR = ?
Selection bias
- Risk of the outcome in exposed and unexposed in all eligible?
- 100/1000 = 10% (same outcome risk in exposed and unexposed in all eligible)
- Exposure-Outcome association in all eligible: RR = ?
- (100/1000) / (100/1000) = 1.0
- Exposure-Outcome association in participants: RR = ?
- (80/480) / (60/260) = 0.72
- Exposure-Outcome association in nonparticipants: RR = ?
- (20/520) / (40/740) = 0.71
- Way of thinking: association in all eligible and in participants is different
DAGs
- Directed acyclic graphs
- Very (very-very-very) quick introduction
- Drawing causal models: how world works
- Variables are associated when
- One causes another
- They have a common cause (confounding)
- They have a common consequence that has been conditioned on (selection bias)

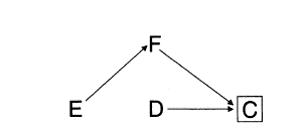
Collider stratification bias
- Structural definition of selection bias
- Collider stratification bias
- Conditioning on common effects

Hernán MA, Hernández-Díaz S, Robins JM. A Structural Approach to Selection Bias. Epidemiology. 2004;15(5):615-25.
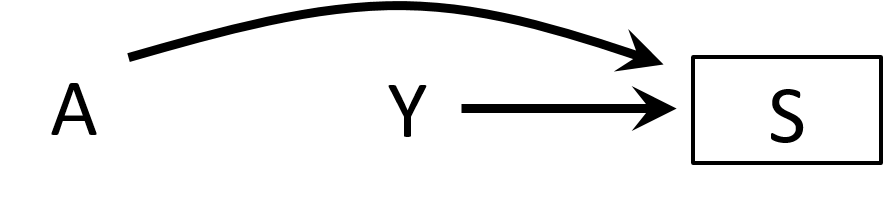
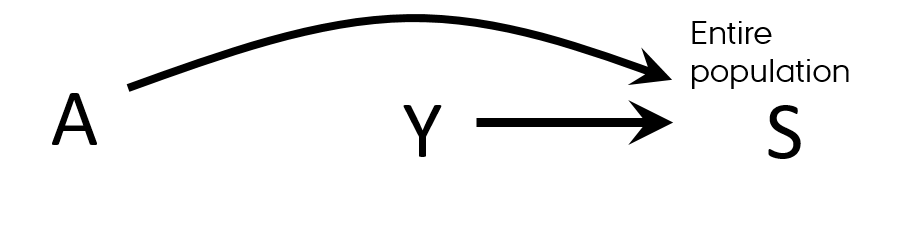
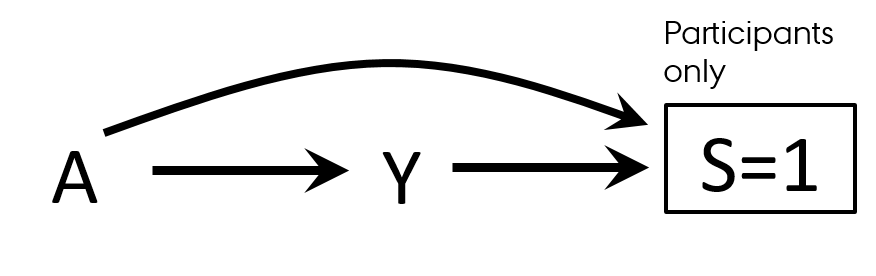
Selection bias
- Differential participation
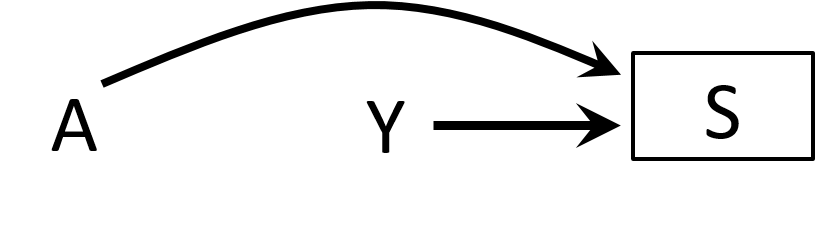
- Case-control study of residence proximity (A) to farms and cancer (Y)
- By definition, we start from selecting cases
- Outcome → participation (S=selection)
- People who live close to the farms are more likely to participate than those who do not live near
- Exposure → participation (S=selection)
- By conditioning on S, we open a biasing path
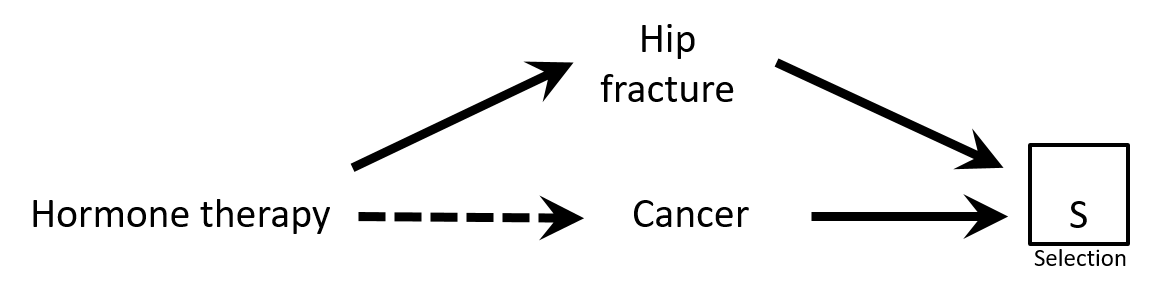
Selection bias
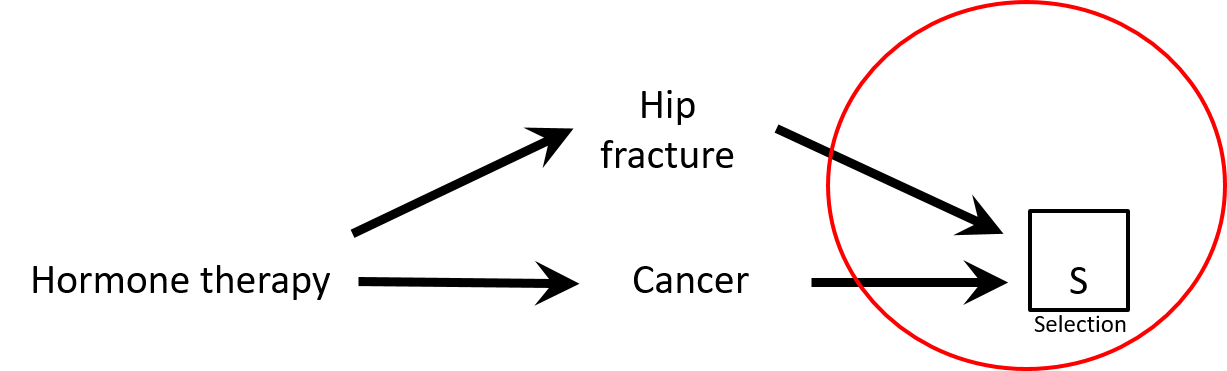
- Case-control study of association between hormone therapy and cancer
- Cancer cases
- Cancer controls are women hospitalized with hip fracture
- Exposure → participation?
- Would there be a selection bias in this study?
Causal Diagrams: Draw Your Assumptions Before Your Conclusions, Hernan
Selection bias
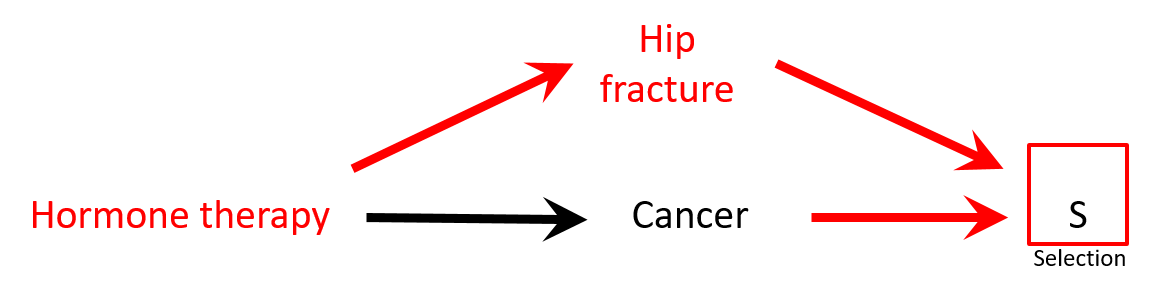
- There is a negative association between hormone replacement therapy (HRT) and hip fracture: HRT → ↓ risk hip fracture
- Controls are less healthy than cases: HRT seems protective against cancer while it is not (spurious association)
Selection bias
- There is a negative association between hormone replacement therapy (HRT) and hip fracture: HRT → ↓ risk hip fracture
- Controls are less healthy than cases: HRT seems protective against cancer while it is not (spurious association)
Selection bias
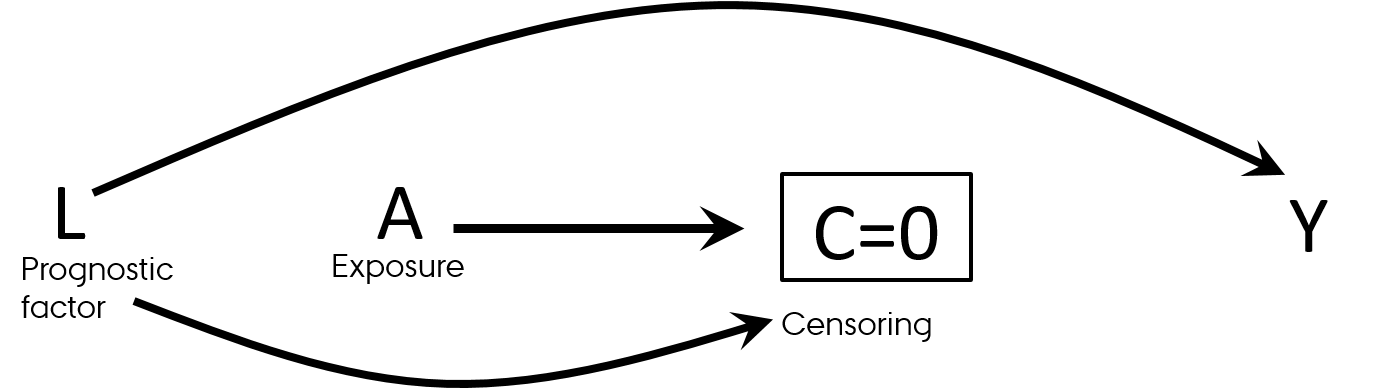
- Differential loss to follow-up (informative censoring)
- Follow-up studies (observational and RCTs)
- Effect in those who was not lost to follow-up
- Think "survivorship bias"
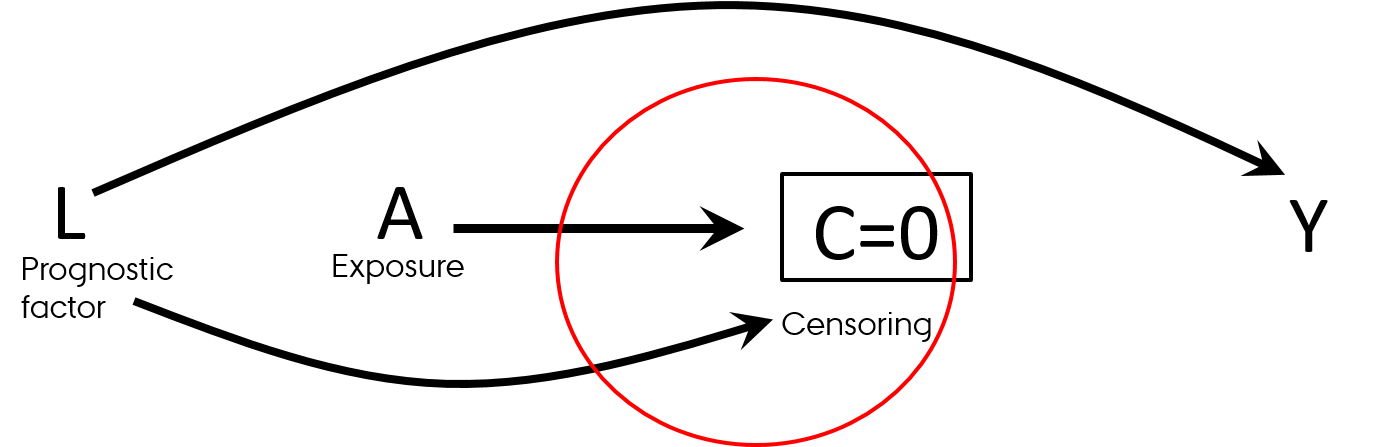
Selection bias
- Differential loss to follow-up (informative censoring)
- Follow-up studies (observational and RCTs)
- Effect in those who was not lost to follow-up
- Think "survivorship bias"
Causal Diagrams: Draw Your Assumptions Before Your Conclusions, Hernan
Selection bias
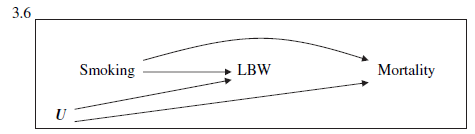
Birth weight paradox
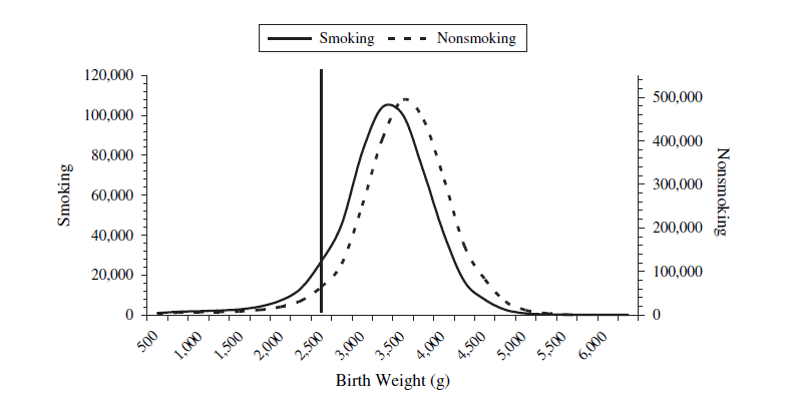
- Infant mortality ~ Smoking: RR = 1.55
- Infant mortality ~ Smoking + Birth weight: RR = 1.05
- Was it a good decision to adjust for birth weight in this model?
Selection bias
Birth weight paradox
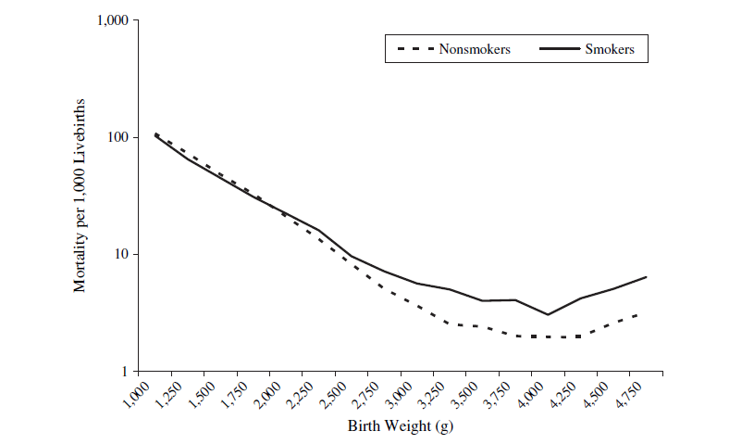
- Strata < 2,000 g (LBW):
- Infant mortality ~ Smoking: RR = 0.79
- Strata >= 2,000 g (not-LBW): RR=1.80
Let's discuss
- Effect of smoking on diabetes
- What to adjust for?
 HarvardX PH559x Causal Diagrams: Draw Your Assumptions Before Your Conclusions
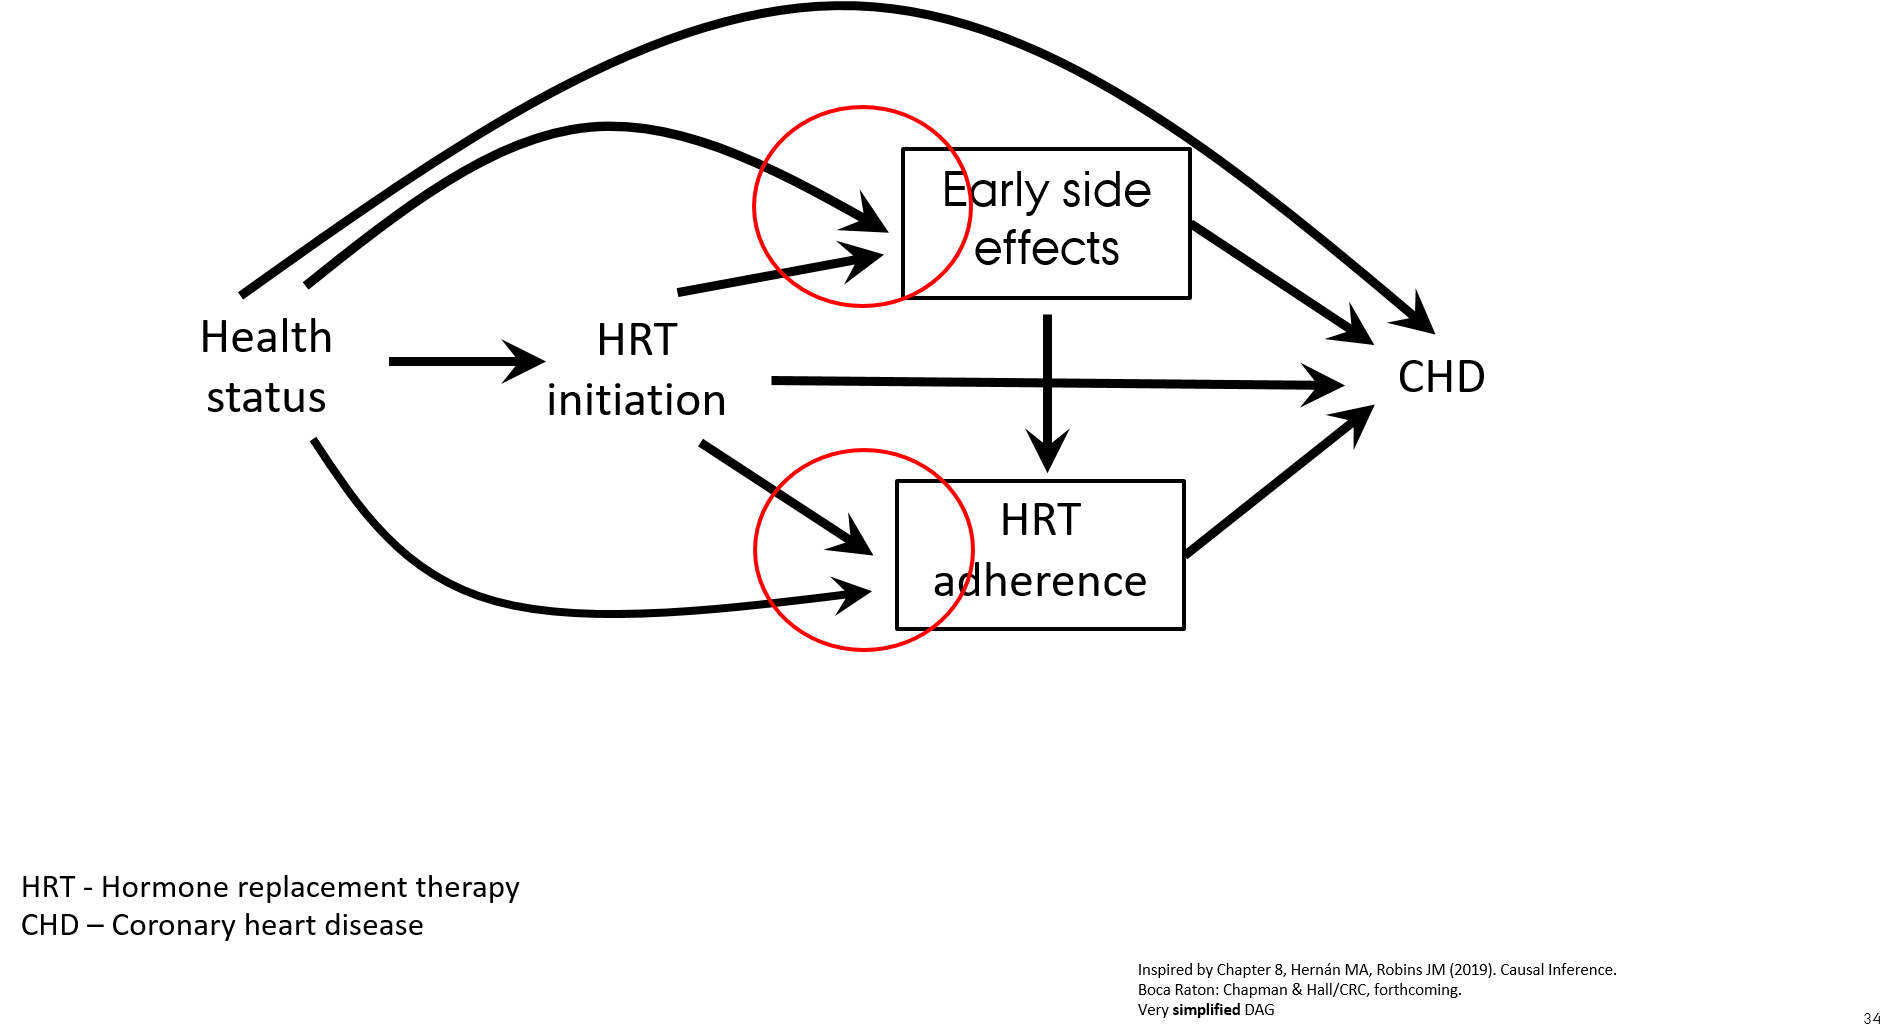
Let's discuss
- When including prevalent and new users of HRT the association with CHD is attenuated due to the effect of prevalent users of HRT who are "long-term survivors of CHD" ("super women" who never developed CHD while on HRT)
- Healthier individuals are more likely to initiate and to stay on preventive treatment
- Treatment initiators with early side effects discontinue HRT ("depletion of susceptible women") → selection mechanism
- When asking a proper research question "what is the effect of starting HRT?" the observational cohort study shows the same results as the RCT

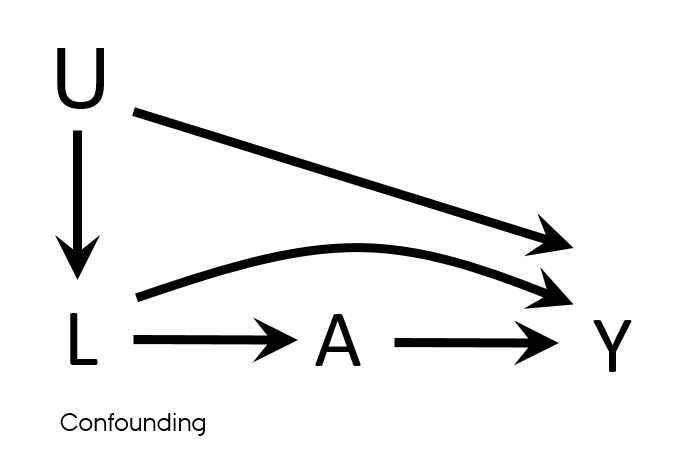
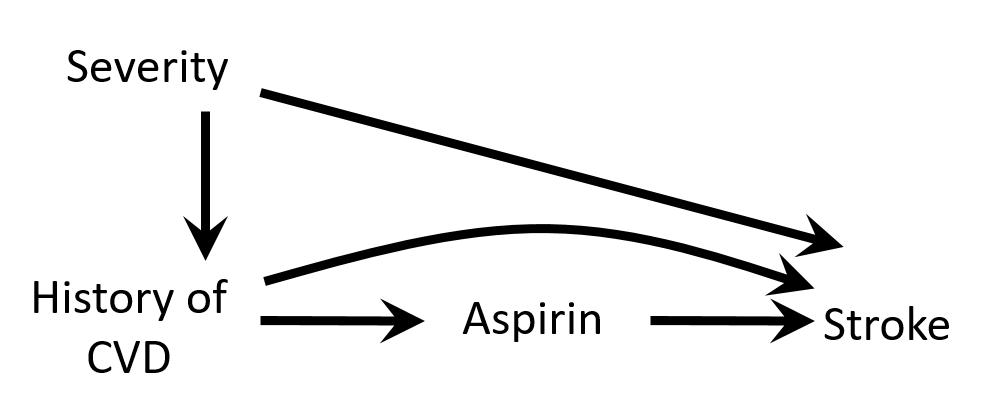
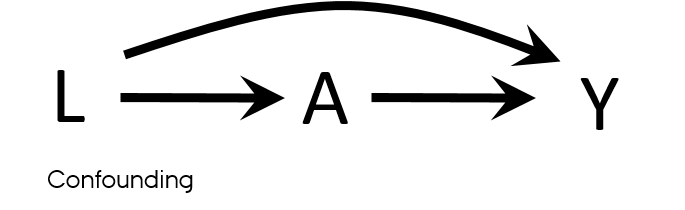
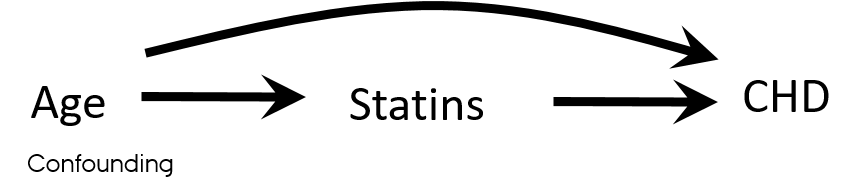
Confounding
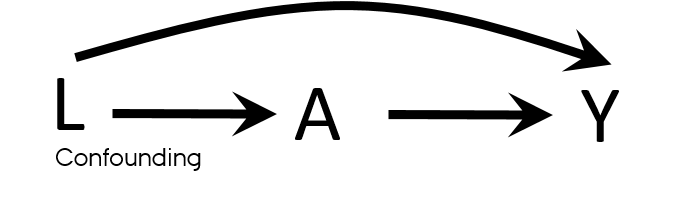
Properties of a confounder
- Associated with the exposure
- Associated with the outcome
- Does not lie on the pathway between exposure and outcome
- Unequally distributed among the exposed and the unexposed
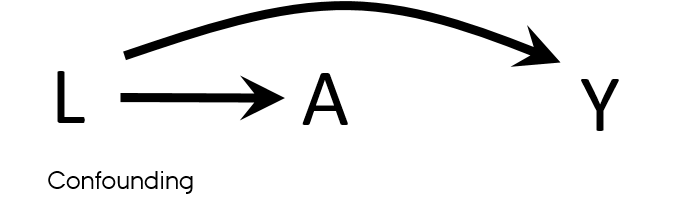
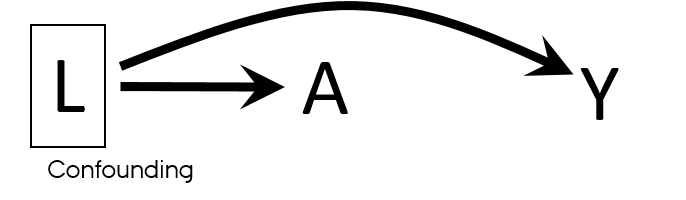
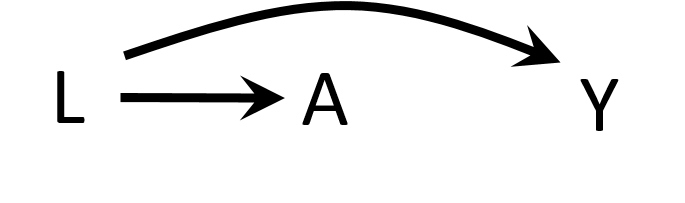
Confounding vs confounders
- Both U and L have properties used to describe confounders
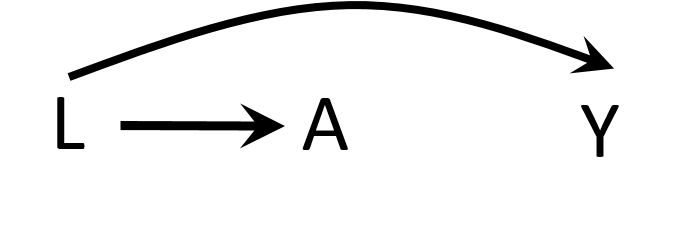
- L → A
- L → Y
- U → L → A
- U → Y
- What if U is unmeasured?
- It is sufficient to adjust for L to eliminate all confounding in this DAG?
Causal Diagrams: Draw Your Assumptions Before Your Conclusions, Hernan
Confounding
Examples from your research
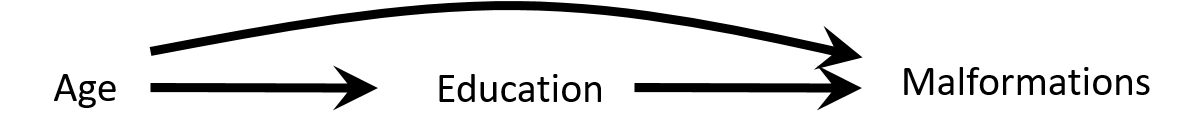
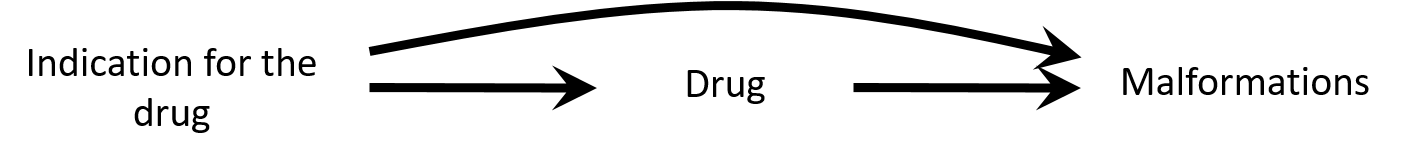
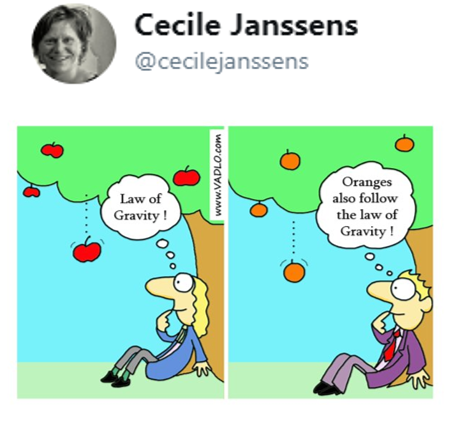
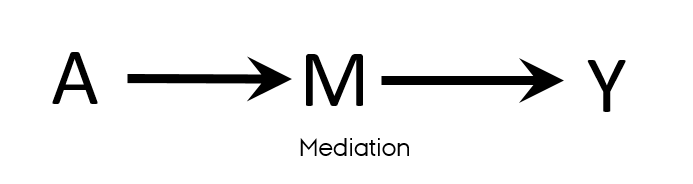
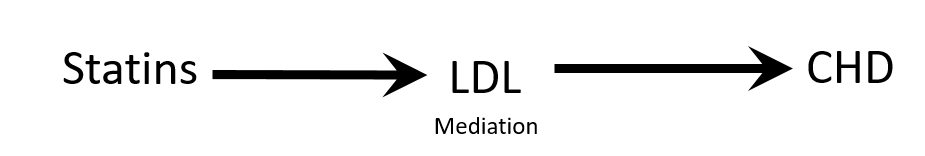
Confounding is not mediation
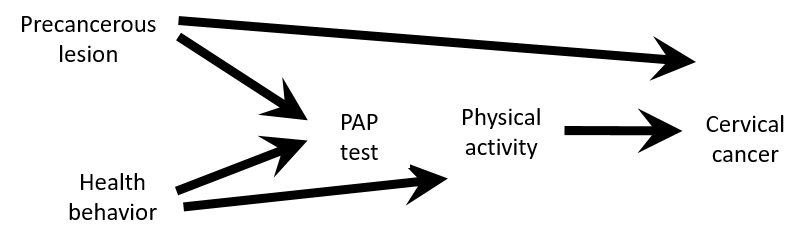
Confounding exercise
- Assume that this causal structure is true
- According to this DAG
- Is there a confounding for an association between physical activity and cervical cancer ?
- Would you stratify by or adjust for PAP-test results?
- Would you restrict the study population to women with PAP+?
Causal Diagrams: Draw Your Assumptions Before Your Conclusions, Hernan
Confounding exercise
- Despite PAP-test variable satisfy properties of a confounder
- Associated with the exposure: healthier women are more likely to take PAP test and are also more likely to be physically active PAP test ← health behaviour → physical activity
- Associated with the outcome: women with precancerous lesion will have a positive PAP test and women with precancerous lesion are at higher risk of having cervical cancer PAP test ← precancerous lesion → cervical cancer
- Not on a causal pathway
- There is no confounding
- PAP test is a collider on a path between Physical activity and Cervical cancer
- Stratifying on or adjusting for the PAP test variable would introduce bias
- Adjust for either Health behavior or Precancerous lesion if only PAP test+ population is available
“Confounding either exists or doesn't exist, but the variable may or may not be a confounder, depending on which other variables are being adjusted for.”
Causal Diagrams: Draw Your Assumptions Before Your Conclusions, Hernan
Confounding
Take home message
Let's discuss
Example 1
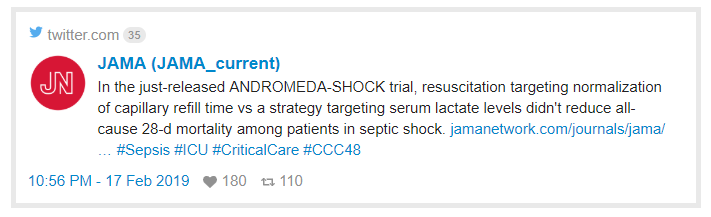
- “28-day mortality was lower with CRT (34%) than with lactate (43%) but the final Cox model shows…”
- HR:0.76 with 95% CI: 0.55-1.02
- Do you agree with the conclusion made by authors?
Let's discuss
Example 1
- “28-day mortality was lower with CRT (34%) than with lactate (43%) but the final Cox model shows…”
- HR:0.76 with 95% CI: 0.55-1.02
- Do you agree with the conclusion made by authors?
“Absence of evidence is not evidence of absence"
- The beneficial effect of CRT vs lactate is consistent with 45% reduced mortality on relative scale and 2% increased mortality on relative scale
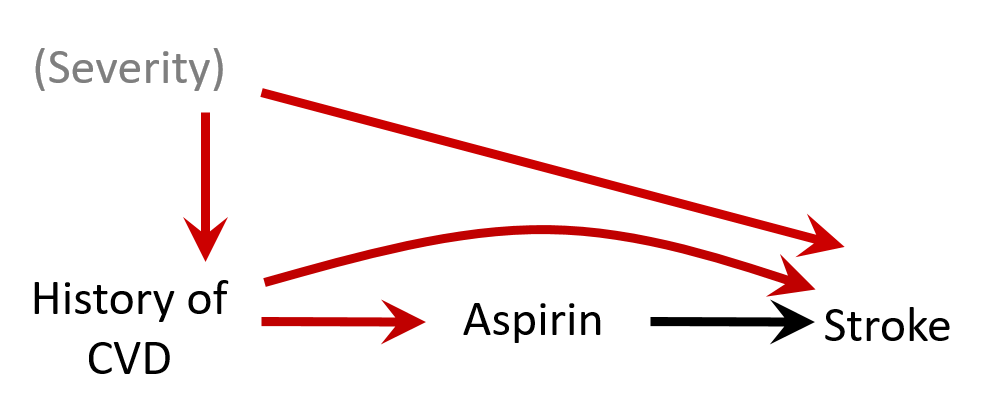
Let's discuss
Example 2
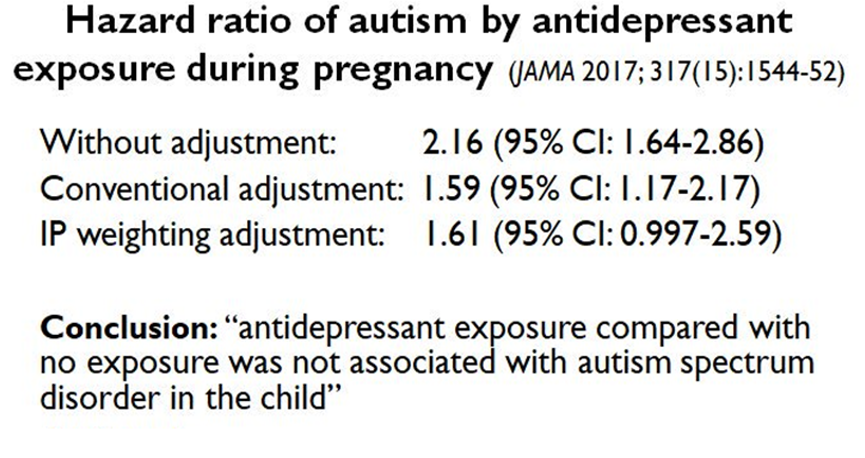
- Do you agree or disagree with conclusion?
- Why or why not?
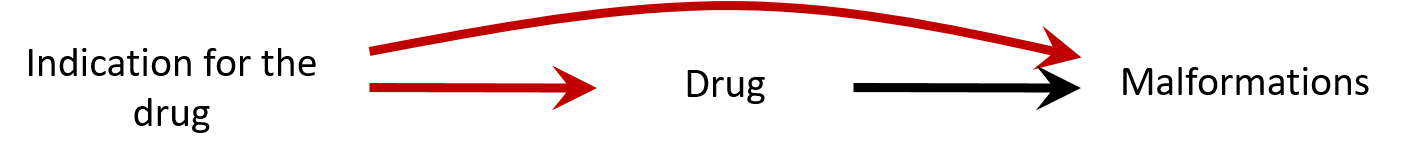
Let's discuss
Example 2
- Do you agree or disagree with conclusion?
- Why or why not?
- Confounding by indication: the association can be explained by insufficient control of the confounding by depression severity
- Bias (e.g. residual confounding by indication) is a threat to validity and needs to be considered when interpreting results
- E-value: https://www.evalue-calculator.com/
- The strength of an association an unmeasured confounder would need to have with exposure and the outcome beyond measured covariables to explain away the observed association
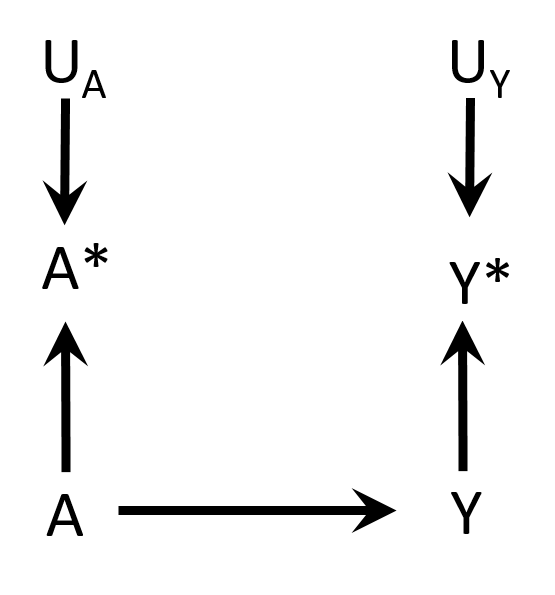
Non-differential misclassification
- Measurement errors and
- Non-differential
- Independent
- E.g. electronic medical records → entry errors
Hernán MA, Robins JM (2019). Causal Inference. Boca Raton: Chapman & Hall/CRC. Chapter 9
Non-differential misclassification
- Non-differential
- Dependent

Hernán MA, Robins JM (2019). Causal Inference. Boca Raton: Chapman & Hall/CRC. Chapter 9
Differential misclassification
- Differential
- Independent
Hernán MA, Robins JM (2019). Causal Inference. Boca Raton: Chapman & Hall/CRC. Chapter 9
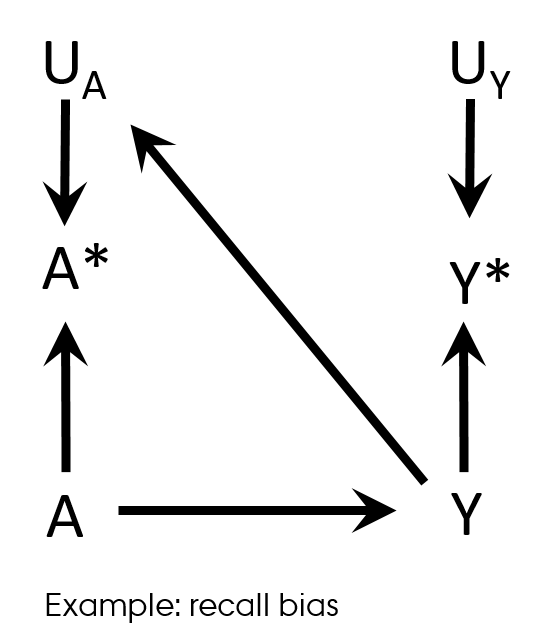
Differential misclassification
Recall bias
- Case-control study design
- Differences in accuracy or completeness of recall between controls and cases
- Differential (and non-dependent) exposure misclassification
Hernán MA, Robins JM (2019). Causal Inference. Boca Raton: Chapman & Hall/CRC. Chapter 9
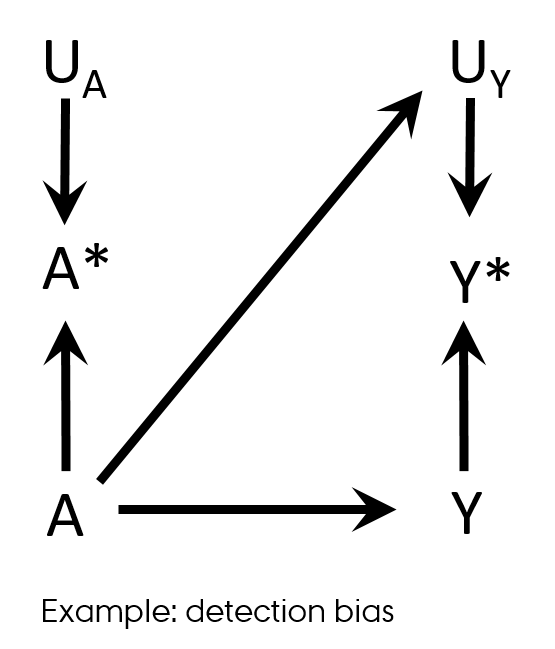
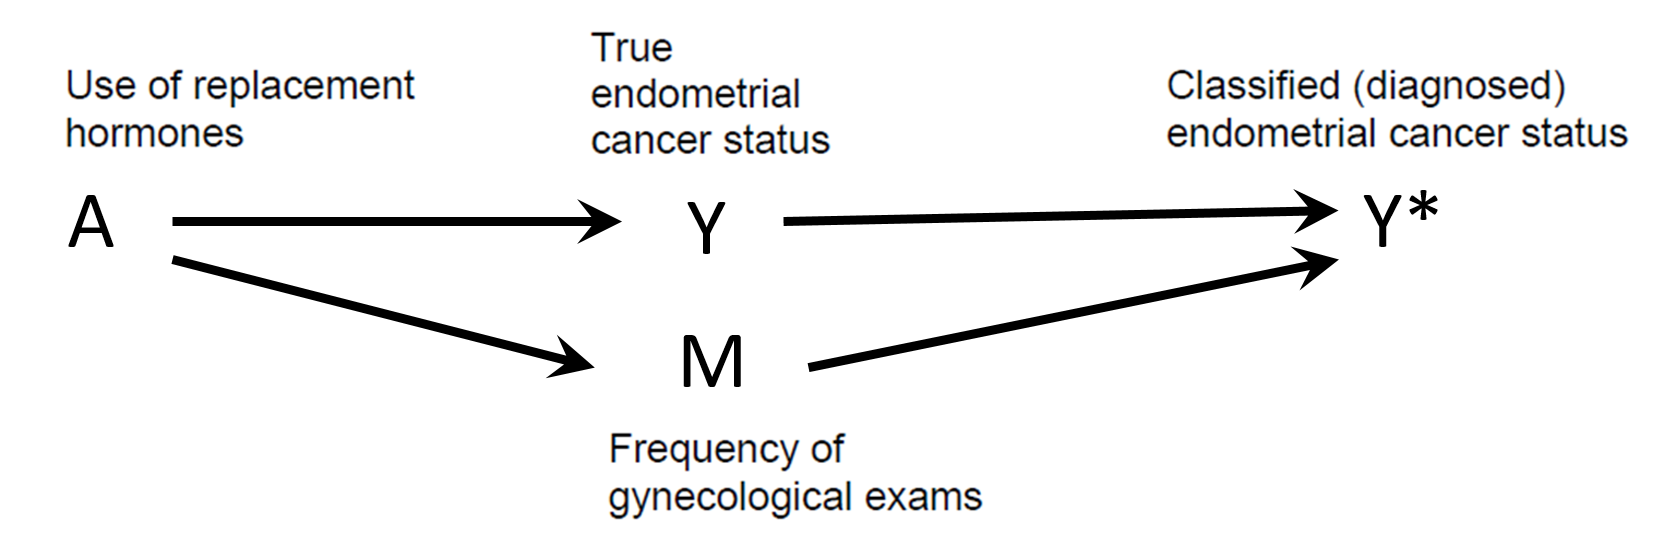
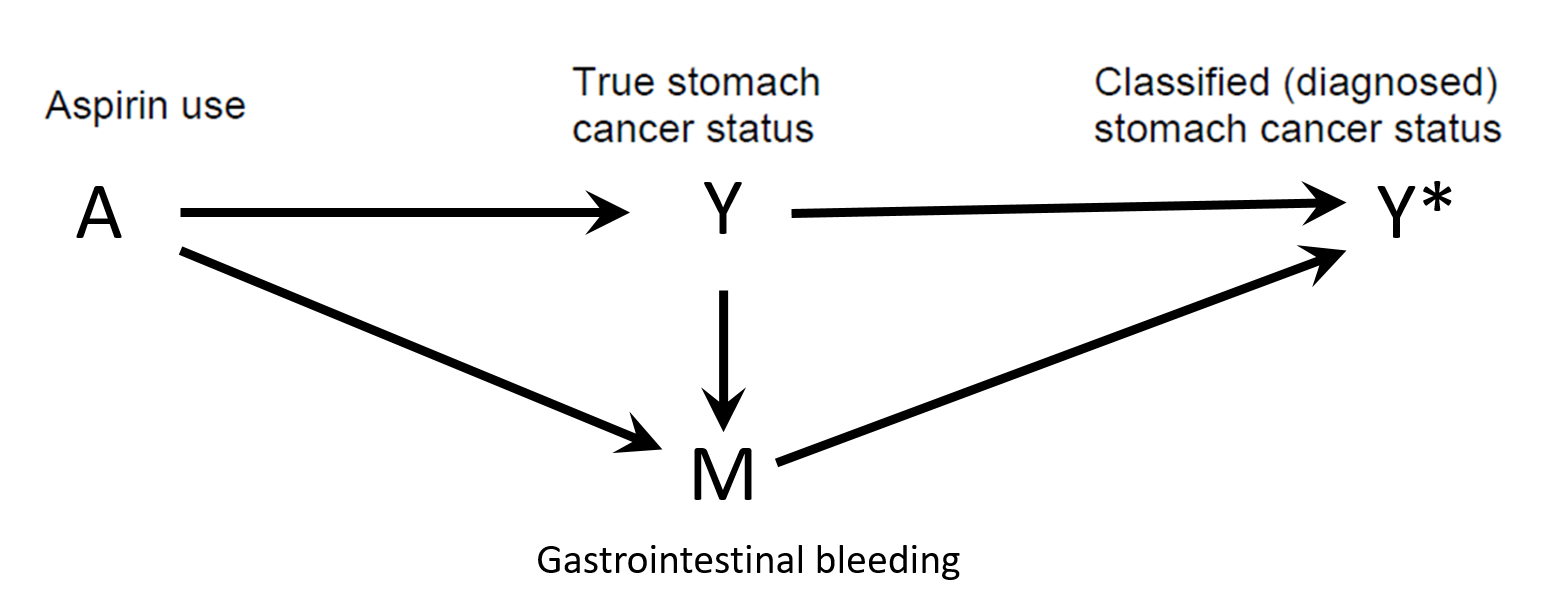
Differential misclassification
Detection bias
- Differential misclassification of the outcome in regard with exposure
 Shahar E. Causal diagrams for encoding and evaluation of information bias. J Eval Clin Pract. 2009;15(3):436-40
Differential misclassification
Detection bias
 Shahar E. Causal diagrams for encoding and evaluation of information bias. J Eval Clin Pract. 2009;15(3):436-40
Differential misclassification
Detection bias in RCT
- Knowledge of a patient’s assigned strategy influences outcome assessment
- Blinding
- Allocation concealment
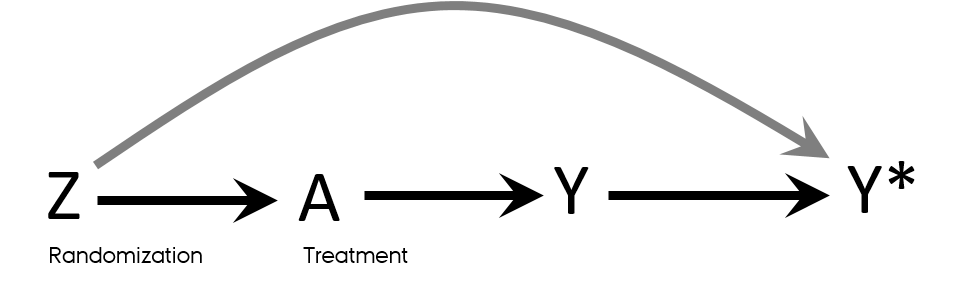
Mansournia MA, Higgins JP, Sterne JA, Hernan MA. Biases in Randomized Trials: A Conversation Between Trialists and Epidemiologists. Epidemiology. 2017;28(1):54-9.
Time-related bias
- It is essentially exposure misclassification
Immortal time: intuition
- Is being awarded Oscar prolongs life?
- Immortal time bias: an actor or director had to stay alive long enough to be classified as “Oscar winner”

Immortal time bias
- Time-dependent exposure definition
- Period between cohort entry and the first prescription for the drug under study → by definition event-free in exposed
- Immortal time
- Misclassified person-time
- Ignored person-time
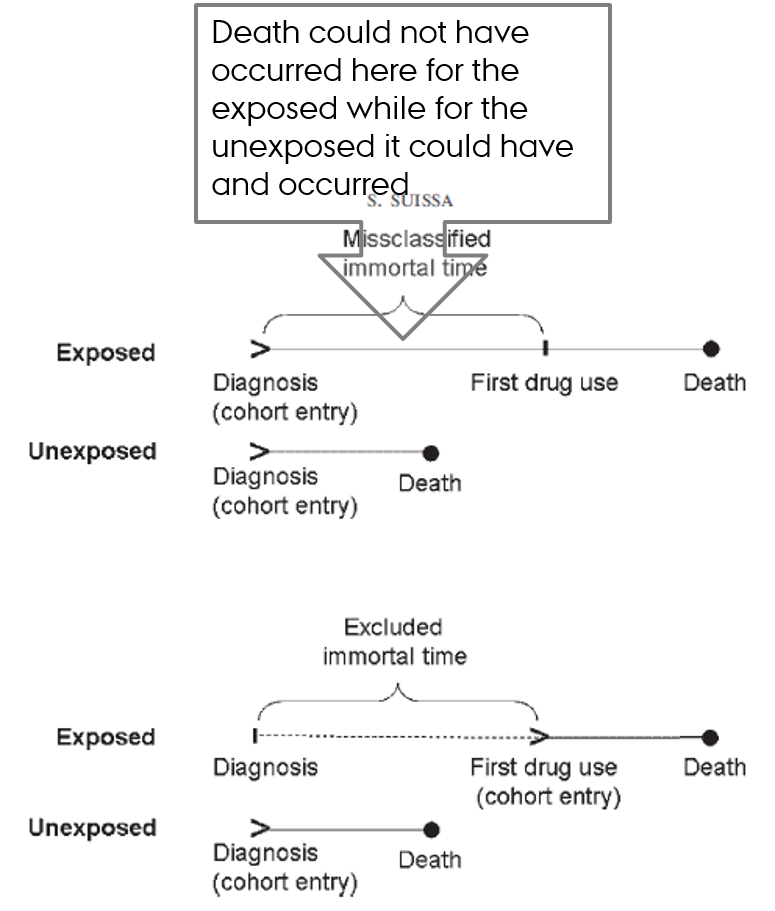
Suissa S. Immortal time bias in observational studies of drug effects. Pharmacoepidemiol Drug Saf. 2007;16(3):241-9.
Hernan MA, Sauer BC, Hernandez-Diaz S, Platt R, Shrier I. Specifying a target trial prevents immortal time bias and other self-inflicted injuries in observational analyses. J Clin Epidemiol. 2016;79:70-5.
Lead time bias
- The added time of illness if the diagnosis is caught during its latency period
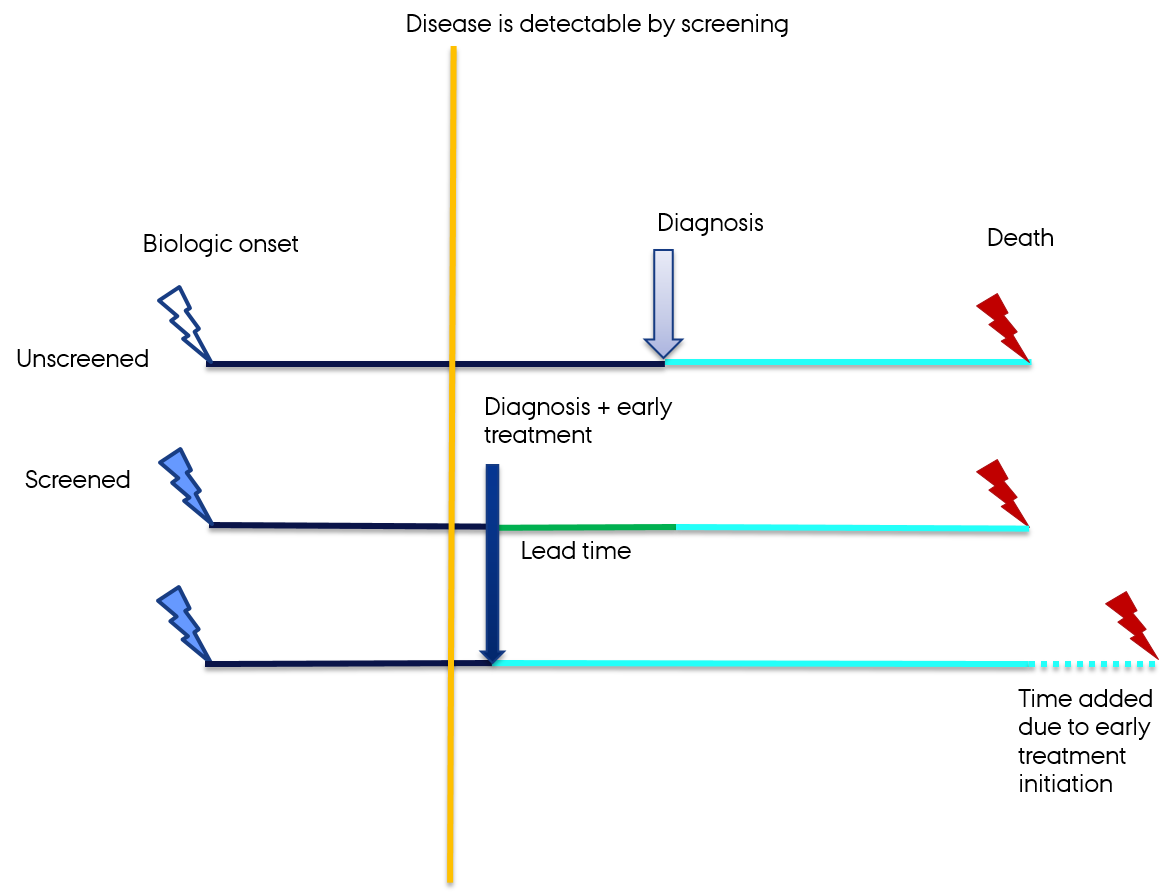 Delgado-Rodriguez M, Llorca J. Bias. J Epidemiol Community Health. 2004;58(8):635-41.
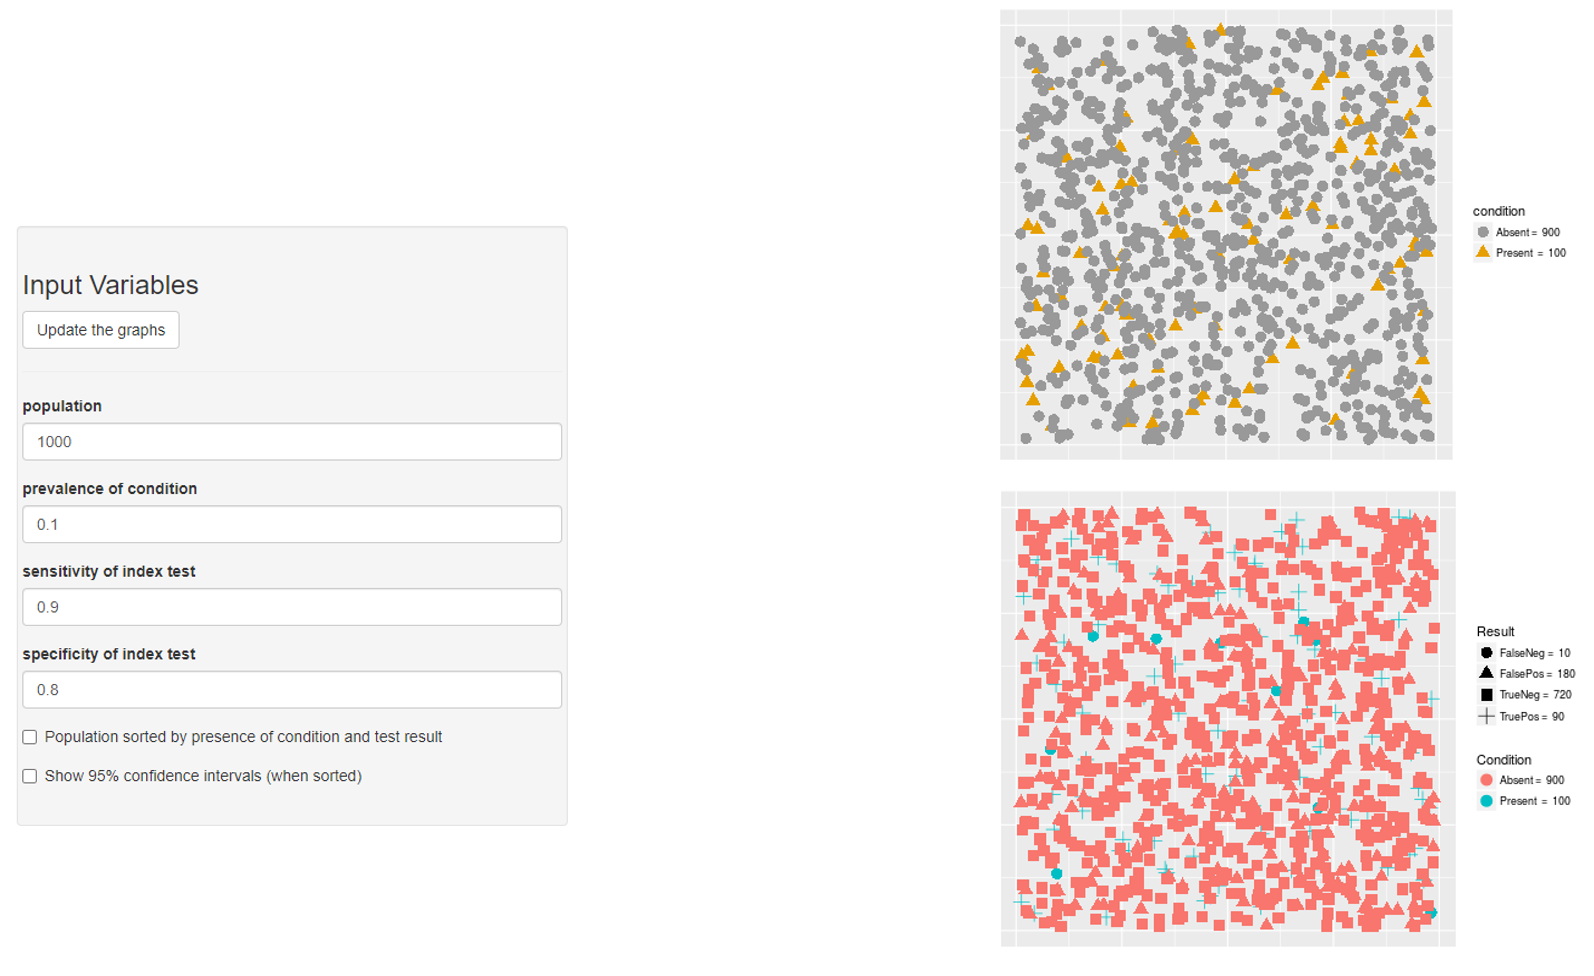
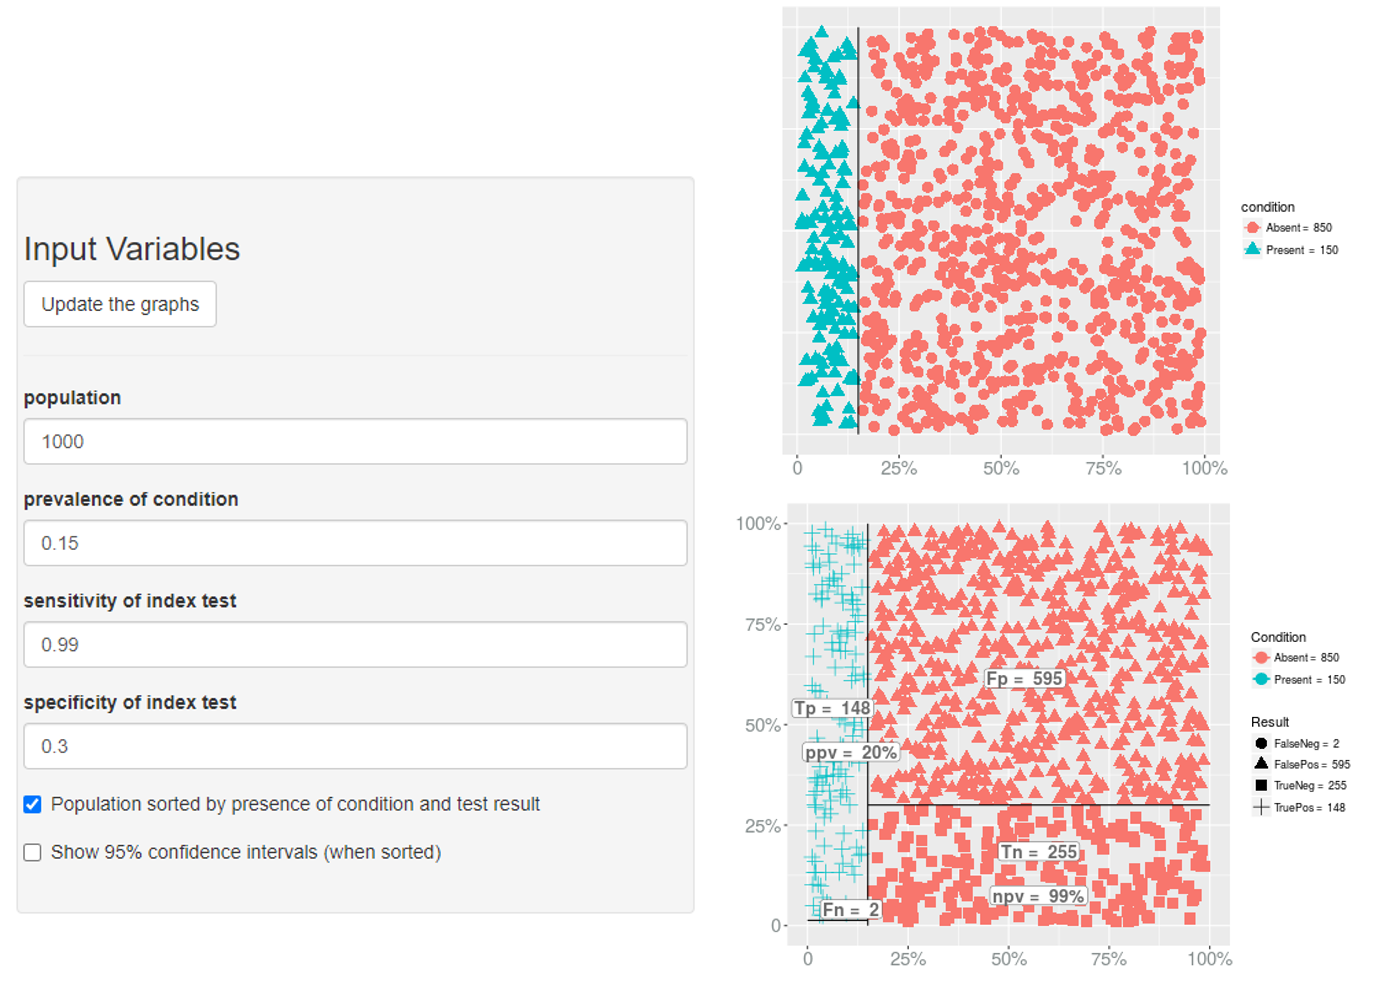
Prevalence → PPV & NPV
Prevalence → PPV & NPV
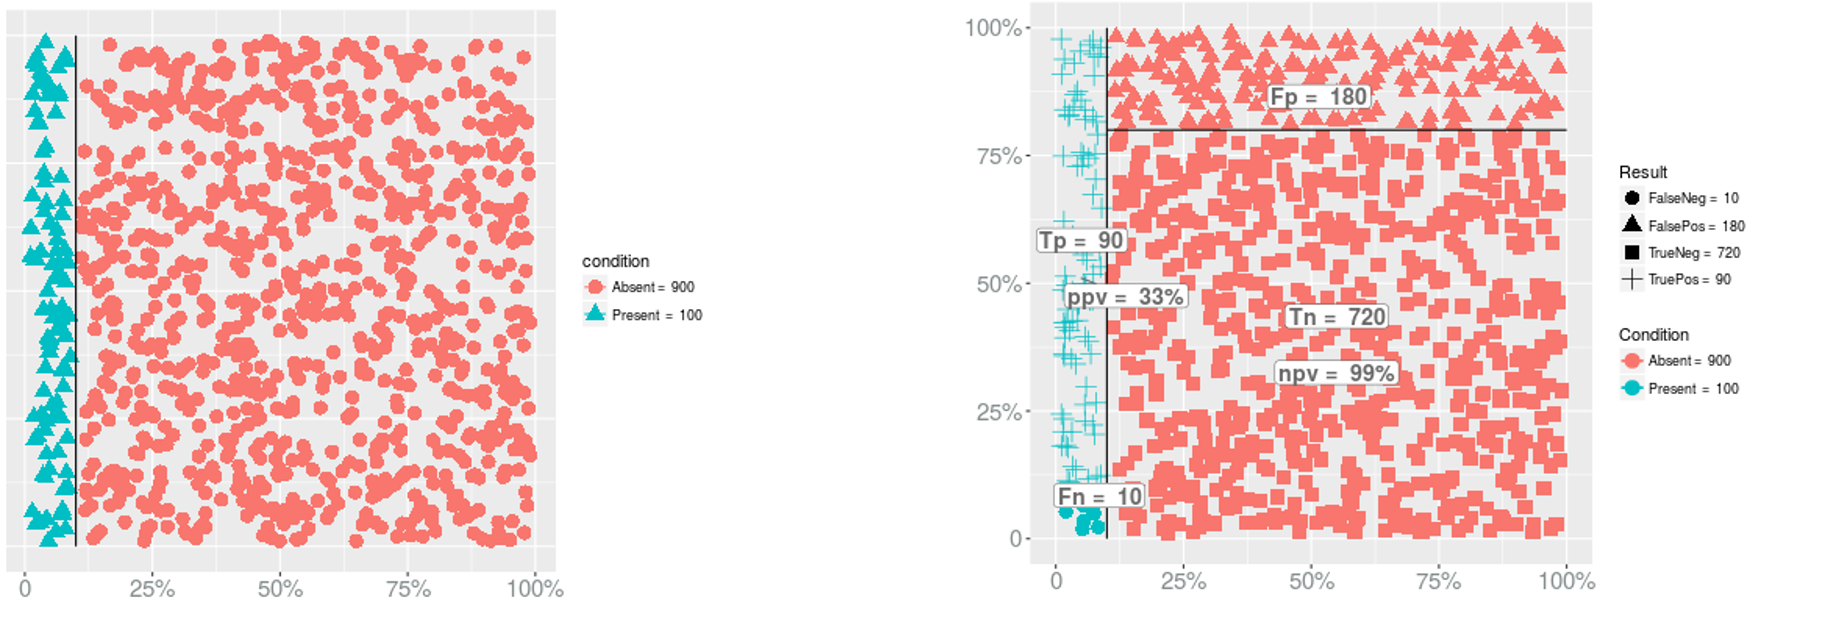
- PPV?
Prevalence → PPV & NPV
- PPV?
- PPV = 90/(180+90) = 0.3333333
Prevalence → PPV & NPV
- PPV?
- PPV = 90/(180+90) = 0.3333333
- NPV?
Prevalence → PPV & NPV
- PPV?
- PPV = 90/(180+90) = 0.3333333
- NPV?
- NPV = 720/(720+10) = 0.9863014
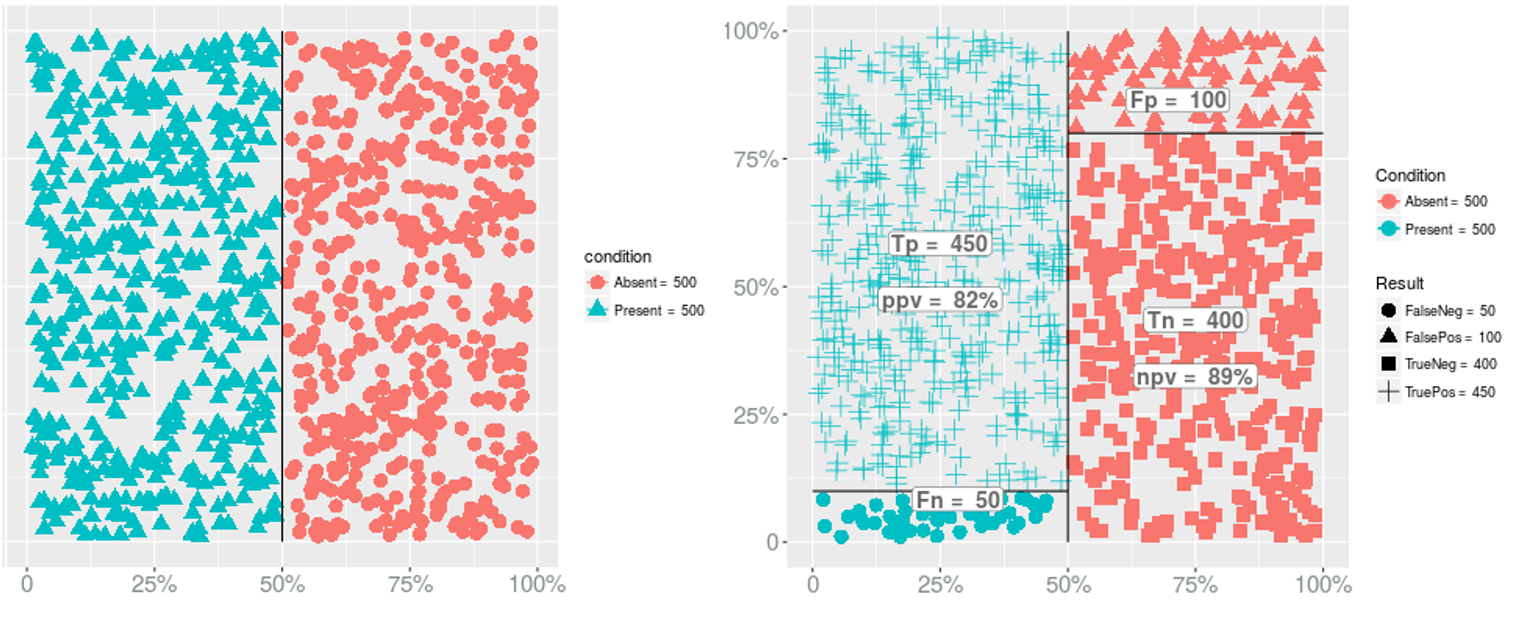
Prevalence → PPV & NPV
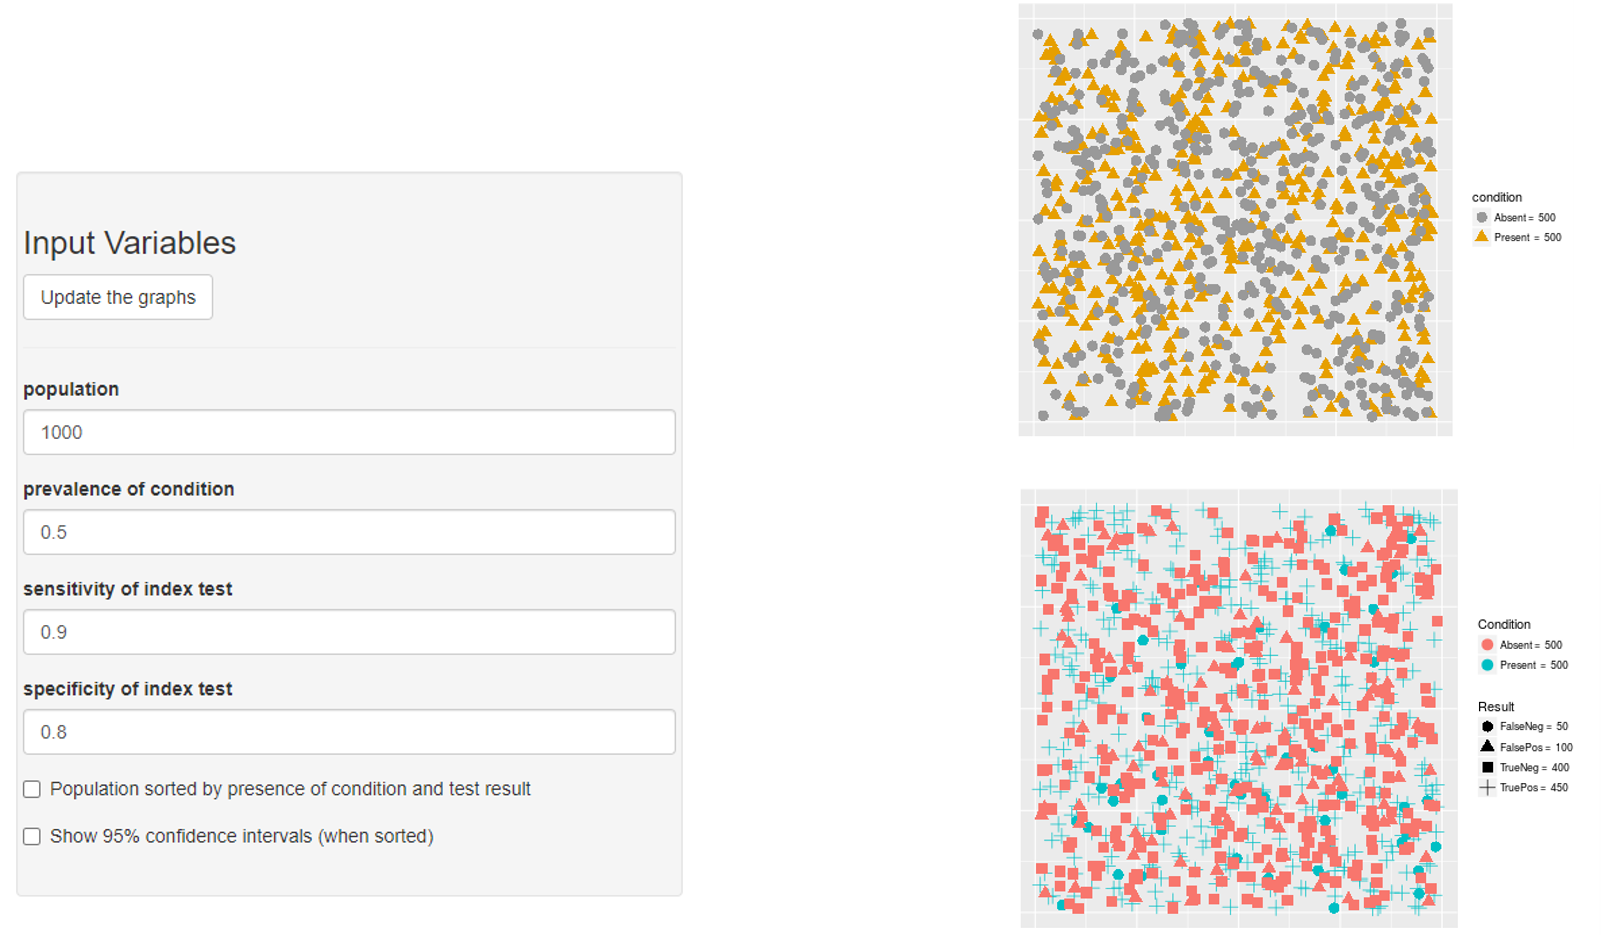
Prevalence → PPV & NPV
Prevalence → Sensitivity
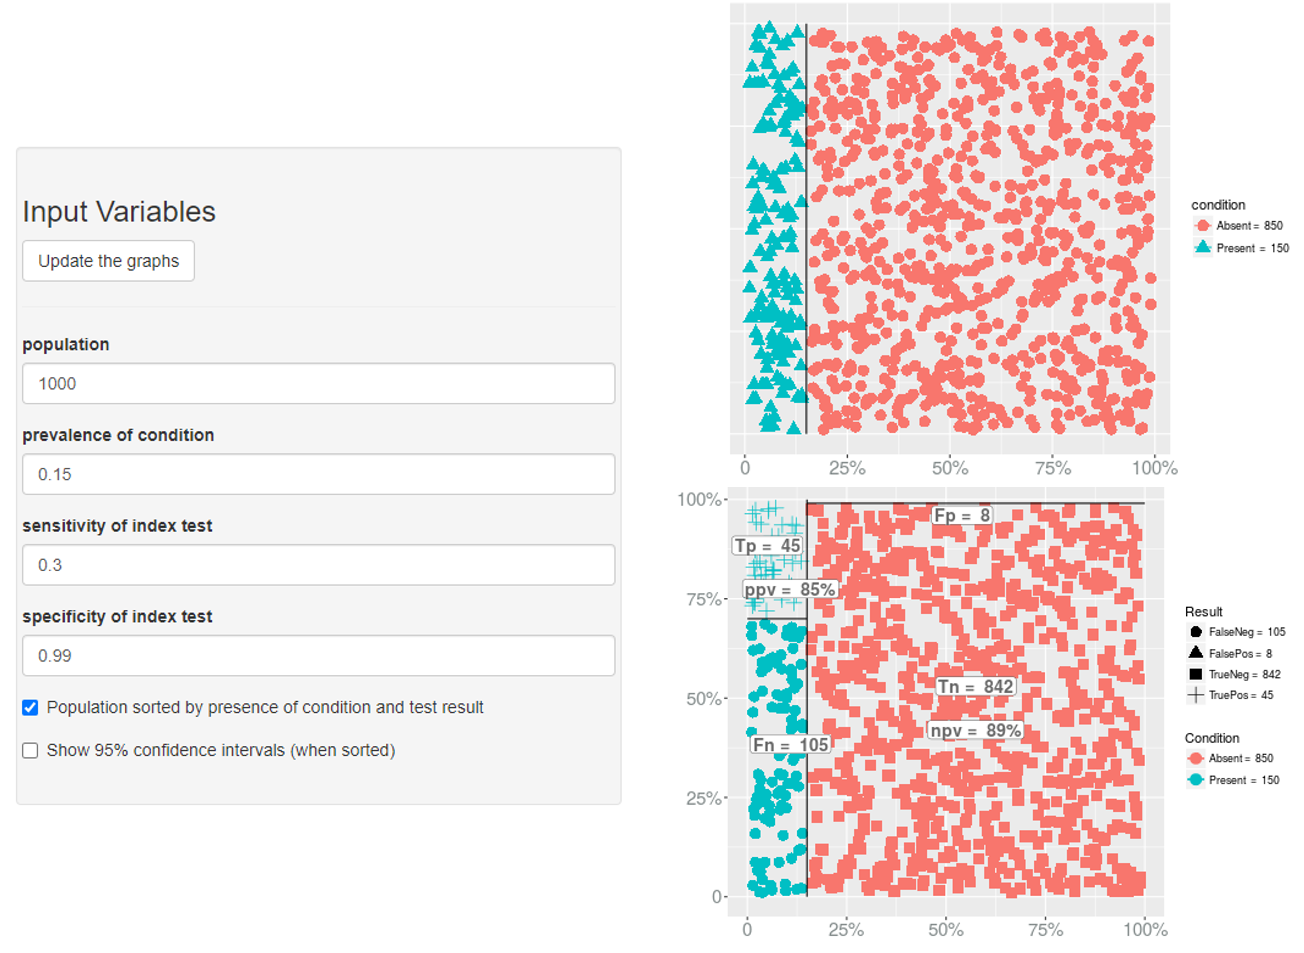
Prevalence → Specificity
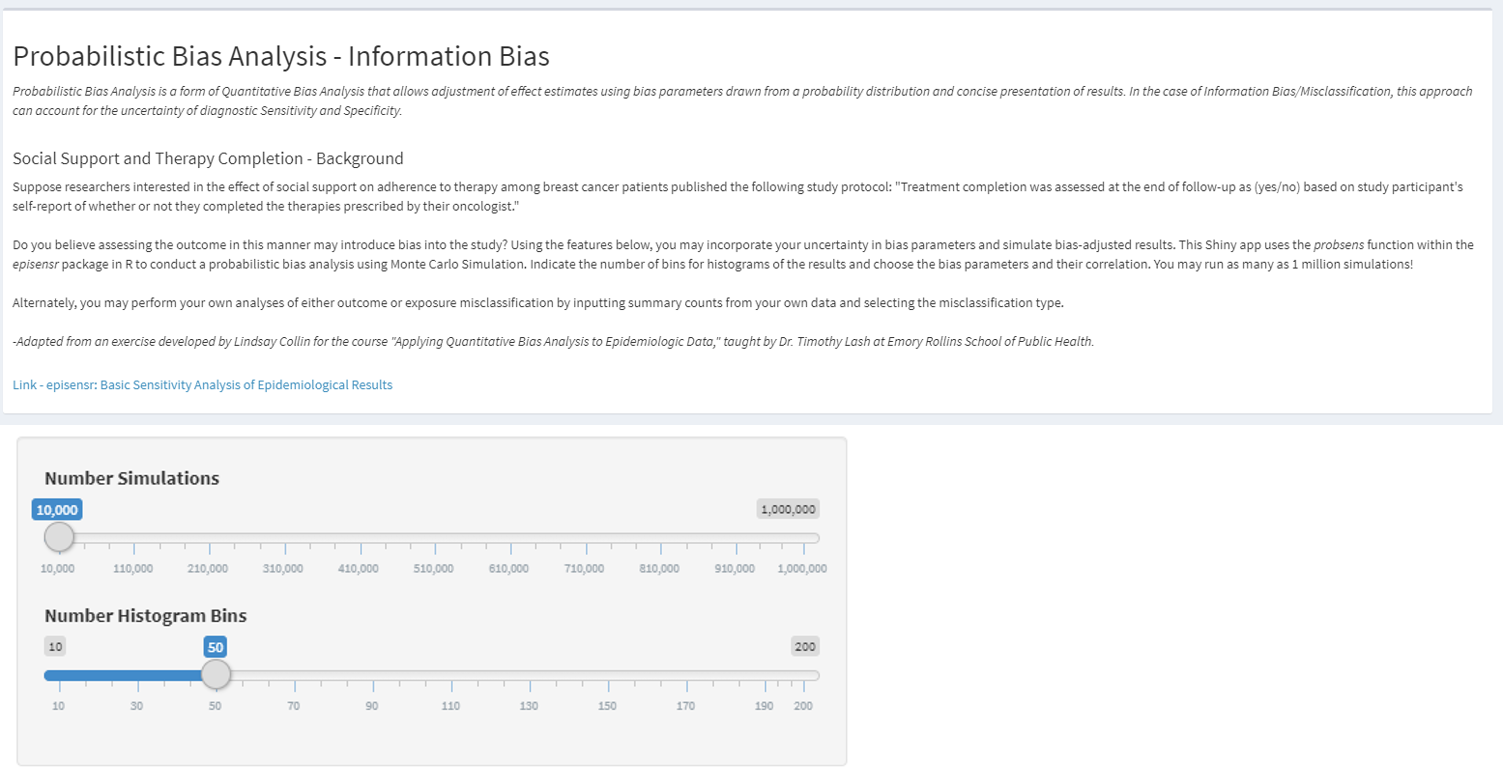
Non-differential misclassification of the exposure
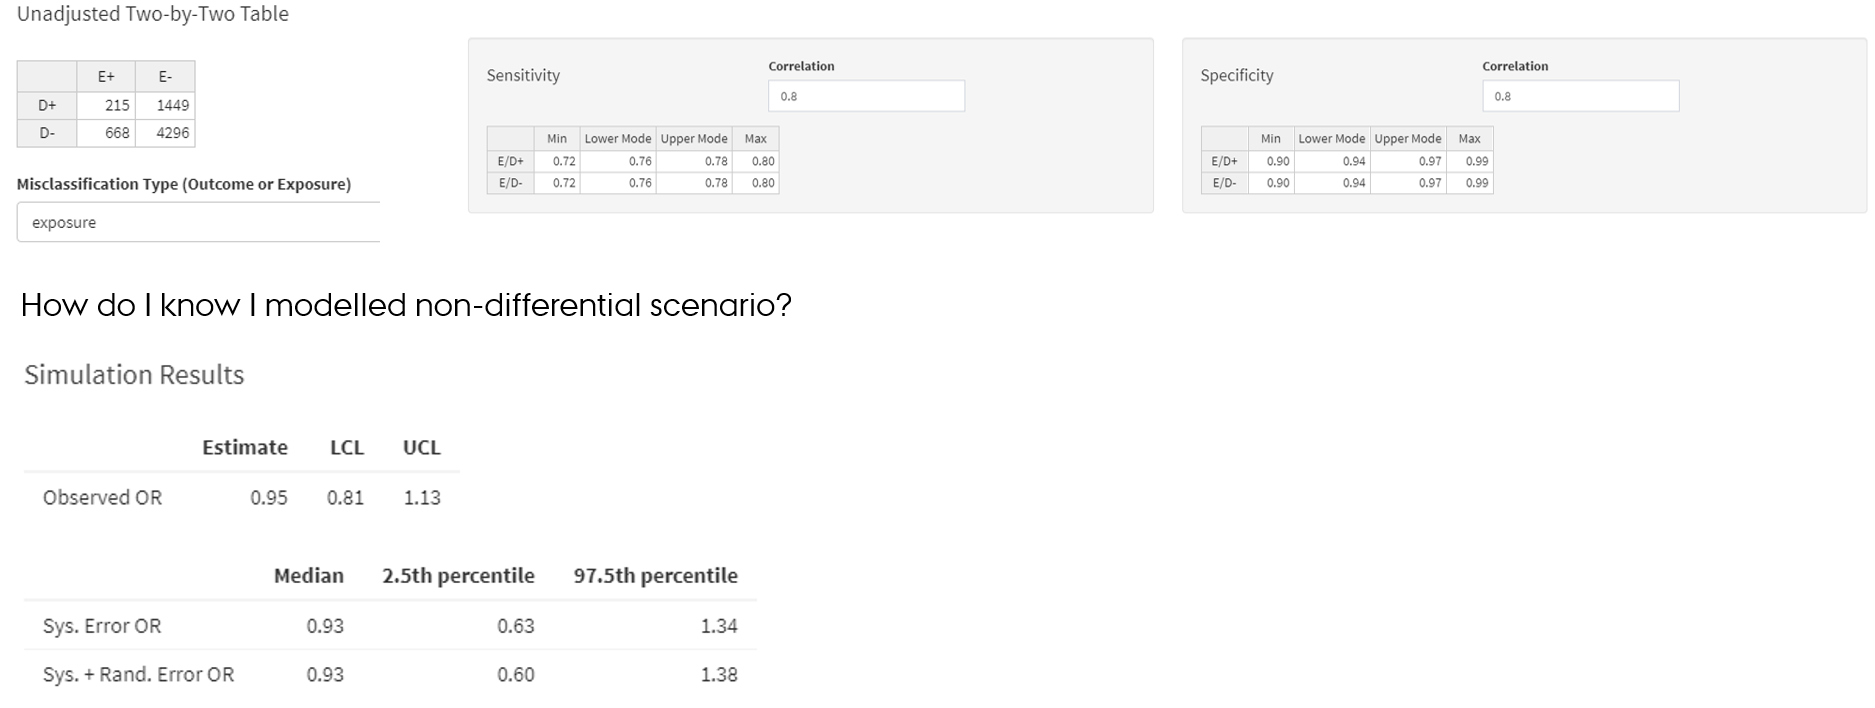
Non-differential misclassification of the exposure
- SE and SP parameters of the exposure are same among outcome+ and outcome- → exposure is misclassified non-differentially in regard to the outcome
Non-differential misclassification of the outcome
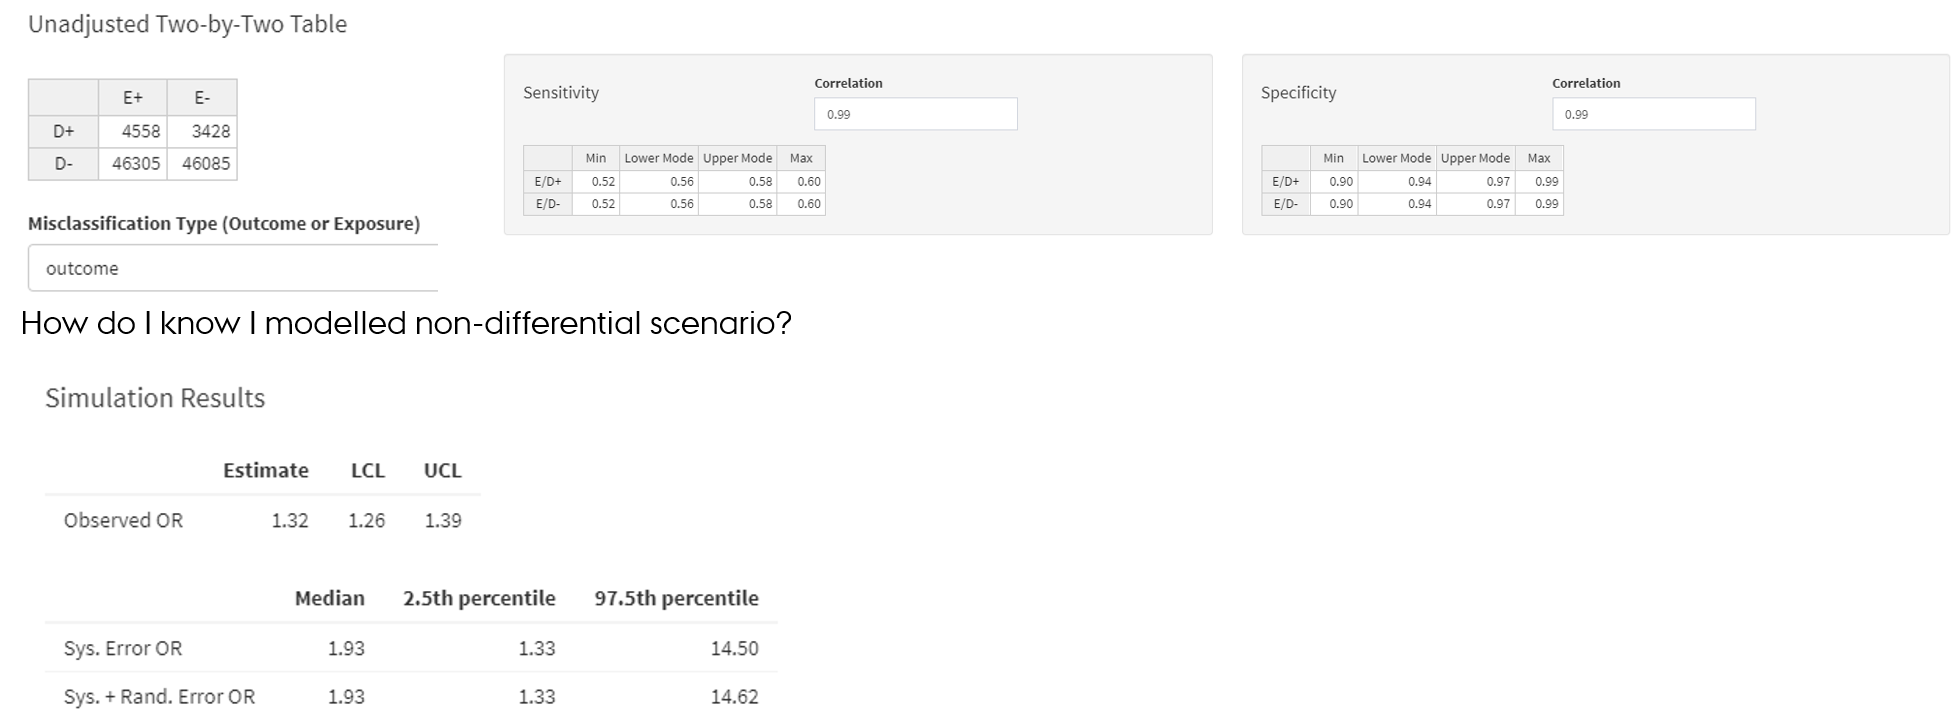
- Lash TL, Fox MP, Fink AK. Applying Quantitative Bias Analysis to Epidemiologic Data. Springer. 2009; Chapter 6 De et al., 1998
- https://graeme-pmott.shinyapps.io/prob_bias_analysis/